
- Title
-
Comparative Analysis of Therapeutic Efficacy and Adverse Reactions among Various Thrombolytic Agents
- Authors
- Xie, C., Zheng, N., Li, M., Zhang, Z., Huang, D., Xiao, M., Chen, D., He, C., Zuo, Z., Chen, X.
- Source
- Full text @ Toxics
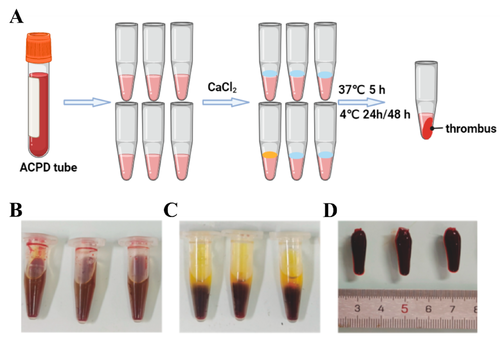
In vitro thrombosis preparation. (A) Diagram of thrombus preparation model in vitro, (B) diagram of thrombus preparation process in vitro, (C) thrombus precipitation, (D) thrombosis. |
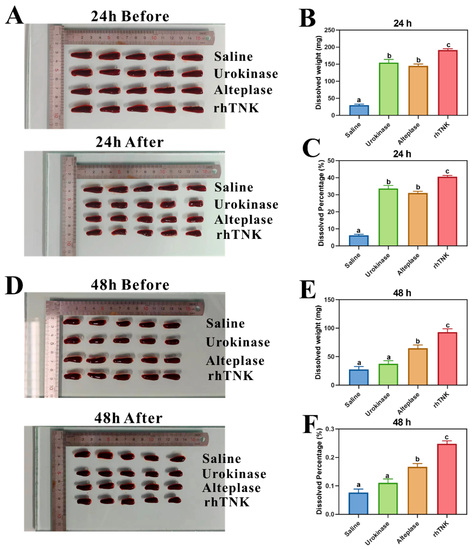
Comparison of thrombolytic effect of different thrombolytic drugs. (A) Typical images before and after thrombolytic therapy of 24 h thrombus, (B) dissolved weight of different thrombolytic drugs’ treatment of 24 h thrombus, (C) dissolved percentage of different thrombolytic drugs’ treatment of 24 h thrombus, (D) typical images before and after thrombolytic therapy of 48 h thrombus, (E) dissolved weight of different thrombolytic drugs’ treatment of 48 h thrombus, (F) dissolved percentage of different thrombolytic drugs’ treatment of 48 h thrombus. The data are presented as the mean ± SE. The different letters on the bar indicate the significant change. |
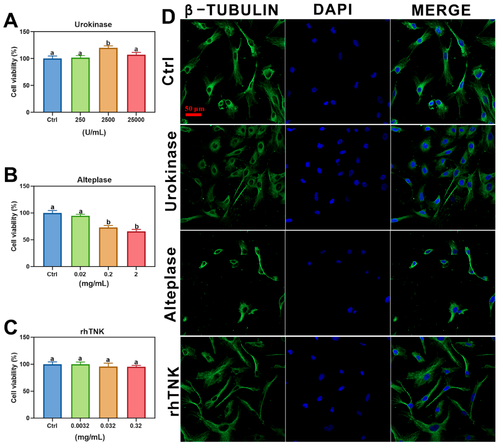
AC16 cell comparing the safety of different thrombolytic drugs. The cell viability of AC16 cells after treatment by Urokinase (A), Alteplase (B), and rhTNK (C). Cytoskeleton stained by β-TUBULIN and nuclear stained DAPI of AC 16 cells after the treatment of the three drugs; green: cytoskeleton, blue: nuclear (D). The data are presented as the mean ± SE. The different letters on the bar indicate the significant change. |
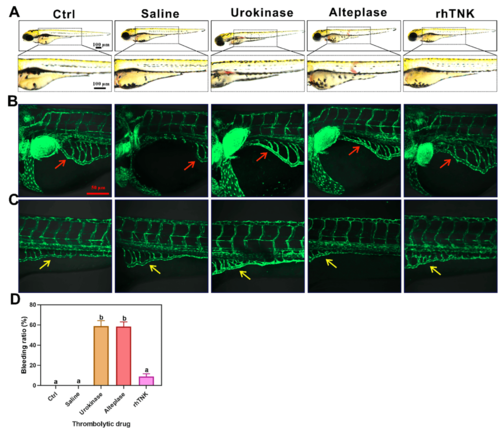
Effects of three thrombolytic drugs on blood vessels of zebrafish. (A) Three thrombolytic drugs’ injection induced zebrafish bleeding. Effects of the three thrombolytic drugs on vascular wall and vascular endothelial cells of Tg(fli1:EGFP) zebrafish, vessels in the head (B), vessels in the tail (C). The bleeding ratio after the injection of the three thrombolytic drugs (D). The data are presented as the mean ± SE. The different letters on the bar indicate the significant change. |
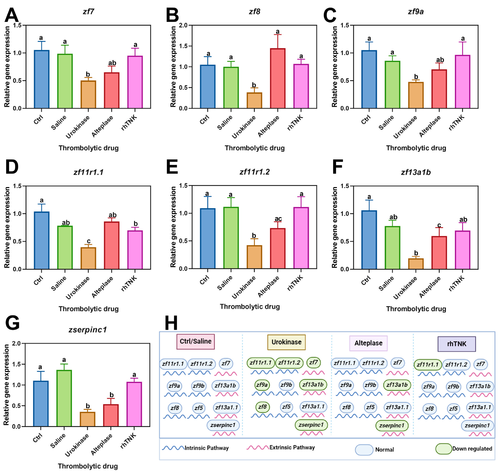
Effect of three thrombolytic drugs on coagulation pathway. The relative expression level of clotting factor was changed by three thrombolytic drugs, zf7 (A), zf8 (B), zf9a (C), zf11r1.1 (D), zf11r1.2 (E), zf13a1b (F). The relative expression level of coagulation inhibitor serpinc1 after the injection of the three thrombolytic drugs (G). (H) Diagram of mechanism of thrombolytic drugs. The data are presented as the mean ± SE. The different letters on the bar indicate the significant change. |