
FIGURE
Fig. 3
- ID
- ZDB-FIG-240729-58
- Publication
- Xie et al., 2024 - Comparative Analysis of Therapeutic Efficacy and Adverse Reactions among Various Thrombolytic Agents
- Other Figures
- All Figure Page
- Back to All Figure Page
Fig. 3
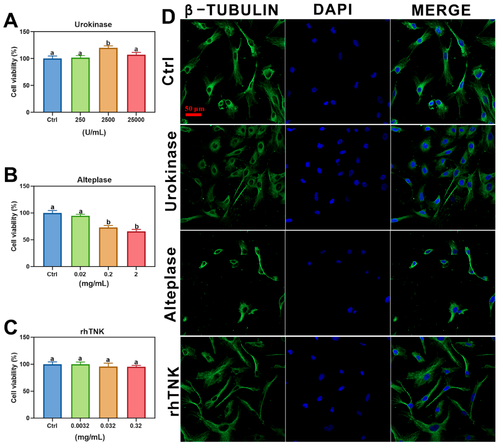
AC16 cell comparing the safety of different thrombolytic drugs. The cell viability of AC16 cells after treatment by Urokinase (A), Alteplase (B), and rhTNK (C). Cytoskeleton stained by β-TUBULIN and nuclear stained DAPI of AC 16 cells after the treatment of the three drugs; green: cytoskeleton, blue: nuclear (D). The data are presented as the mean ± SE. The different letters on the bar indicate the significant change. |
Expression Data
Expression Detail
Antibody Labeling
Phenotype Data
Phenotype Detail
Acknowledgments
This image is the copyrighted work of the attributed author or publisher, and
ZFIN has permission only to display this image to its users.
Additional permissions should be obtained from the applicable author or publisher of the image.
Full text @ Toxics