
Fig. 2
- ID
- ZDB-FIG-240729-57
- Publication
- Xie et al., 2024 - Comparative Analysis of Therapeutic Efficacy and Adverse Reactions among Various Thrombolytic Agents
- Other Figures
- All Figure Page
- Back to All Figure Page
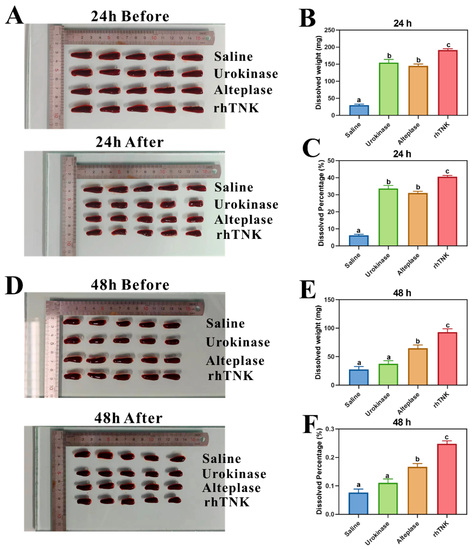
Comparison of thrombolytic effect of different thrombolytic drugs. (A) Typical images before and after thrombolytic therapy of 24 h thrombus, (B) dissolved weight of different thrombolytic drugs’ treatment of 24 h thrombus, (C) dissolved percentage of different thrombolytic drugs’ treatment of 24 h thrombus, (D) typical images before and after thrombolytic therapy of 48 h thrombus, (E) dissolved weight of different thrombolytic drugs’ treatment of 48 h thrombus, (F) dissolved percentage of different thrombolytic drugs’ treatment of 48 h thrombus. The data are presented as the mean ± SE. The different letters on the bar indicate the significant change. |