
- Title
-
Matrix first, minerals later: fine-tuned dietary phosphate increases bone formation in zebrafish
- Authors
- Cotti, S., Di Biagio, C., Huysseune, A., Koppe, W., Forlino, A., Witten, P.E.
- Source
- Full text @ JBMR Plus
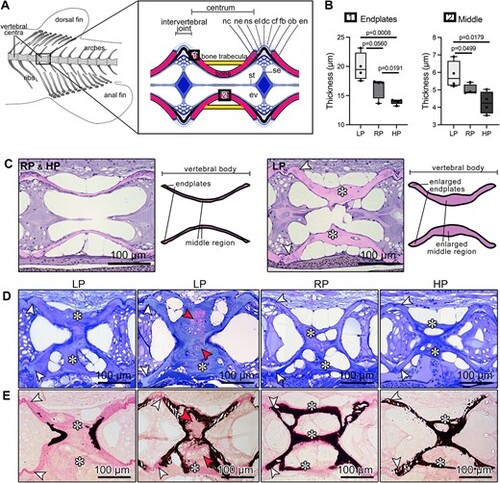
Bone formation increases and bone mineralization is arrested following LP diet. (A) Scheme of the vertebral column of an adult zebrafish indicating the location of the vertebral centra used for analysis. The box shows a schematic of the midline sagittal plane of a vertebral body centrum and two intervertebral joints. Osteoblasts (ob) deposit new bone matrix at the vertebral body endplates (en), i.e. the bone growth zones, which are connected by intervertebral ligaments. From inside to outside, the ligaments consist of the notochord sheath (ns, a collagen type II layer secreted by the cells of the notochord epithelium, ne), the outer elastin layer (el), and dense collagen type I fiber bundles (dc) produced by fibroblasts (fb). The collagen type I fiber bundles (cf) continue in the bone of the vertebral body endplates (en) as Sharpey fibers. The notochord is composed of vacuolated notochord cells (nc) and extracellular vacuoles (ev). Condensed notochord cells constitute the notochord septum (se) and the notochord strand (st). Boxes show locations where the bone thickness was measured, i.e. endplates (1) and middle region of the autocentrum (2). (B) Bone thickness measurements at vertebral endplates and middle region of the autocentrum from LP, RP, and HP animals aftertwo months of dietary treatment. LP zebrafish have thicker structures compared to RP and HP animals (see also Table S2). Values are reported with Box and Whisker plots: the midline in each box is indicative of the median, whereas min and max values are shown with whiskers. Individual data points and P values are shown. (C) Sagittal demineralized histological sections stained with elastin staining and schematics showing vertebral bodies from RP (representative also of HP) and LP animals. LP zebrafish have enlarged vertebral body endplates (white arrowheads) and middle region (asterisks) compared to RP and HP. (D) Toluidine blue stained sagittal sections of vertebral bodies from LP, RP, and HP show that vertebral endplates (white arrowheads) and trabecular bone (asterisks) are considerably thicker in LP animals in comparison with controls and HP fish. Red arrowheads show chondroid bone. (E) Von Kossa/Van Gieson stained non-demineralized sections show a similar sectional plane as in D. The additional bone formed under the LP diet conditions is mostly non-mineralized at vertebral endplates (white arrowheads) and trabecular bone (asterisks) compared to RP and HP. Non-mineralized bone: pink; mineralized bone: black. Some vertebral bodies from LP individuals present enlarged (asterisks) bone trabeculae characterized by the presence of chondroid bone (red arrowheads), which is largely non-mineralized as demonstrated by Von Kossa/Van Gieson staining. |
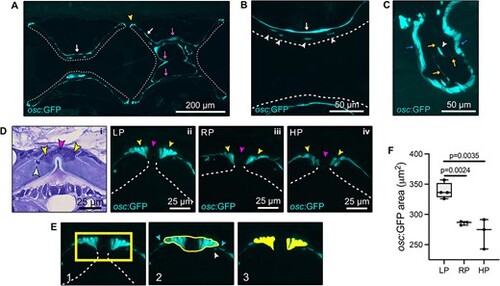
Expression of osteocalcin in the vertebral column assessed in transgenic osc:GFP zebrafish line fed LP, RP, HP for two months. (A–C) Independent from dietary P intake, osteocalcin is expressed by osteoblasts at vertebral body endplates (yellow arrowhead, A) and by bone lining cells at the bone surface (white arrows, A,B), the trabecular bone (magenta arrows, A) and arches (blue arrows, C). Dashed lines indicate the inner bone surface. Osteocytes (white arrowheads in B and C) are osc:GFP positive. The osteocytic canalicular network is also labeled (yellow arrows, C). (D) Toluidine blue stained zebrafish vertebral endplates (i) showing osteoblasts (yellow arrowheads), fibroblasts (magenta arrowheads), and osteocyte (white arrowhead). Osteoblasts (yellow arrowheads) from LP (ii), RP (iii), and HP (iv) zebrafish are osc:GFP positive, but fibroblasts (magenta arrowheads) are osc:GFP negative. (E) Selection of the area used for quantification of the osc:GFP-positive area occupied by osteoblasts at vertebral body endplates, considering only osteoblasts and excluding osteocytes (white arrowhead) and bone lining cells (light blue arrowheads). (F) LP zebrafish have a significantly increased osc:GFP signal area, i.e. the area occupied by GFP-positive osteoblasts, at vertebral endplates compared to RP and HP. Values are reported with Box and Whisker plots: the midline in each box is indicative of the median, whereas min and max values are shown with whiskers. Individual data points and P values are shown. |
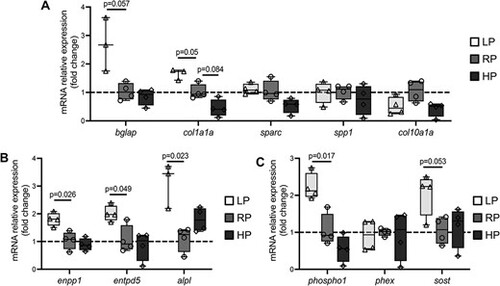
qPCR results. (A) Expression of the osteoblast-related markers osteocalcin (bglap) and collagen type I (col1a1a) is upregulated in LP animals compared to controls. Other osteoblast markers, i.e. osteonectin (sparc), osteopontin (spp1), and collagen type X (col10a1a), do not show differential expression between the three dietary groups. (B) Expression of the mineralization-related markers ectonucleotide pyrophosphatase phosphodiesterase 1 (enpp1), ectonucleoside triphosphate/diphospho-hydrolase 5 (entpd5), and tissue non-specific alkaline phosphatase (alpl) is significantly upregulated in LP zebrafish compared to controls. (C) Expression of the P-associated markers phosphatase orphan 1 (phospho1) and sclerostin (sost) is upregulated in LP zebrafish compared to controls. Phosphate regulating gene with homologies to endopeptidases on the X chromosome (phex) is not differentially expressed. In all panels, values are reported with Box and Whisker plots: the midline in each box is indicative of the median, whereas min and max values are shown with whiskers. Individual data points and P values are shown. |
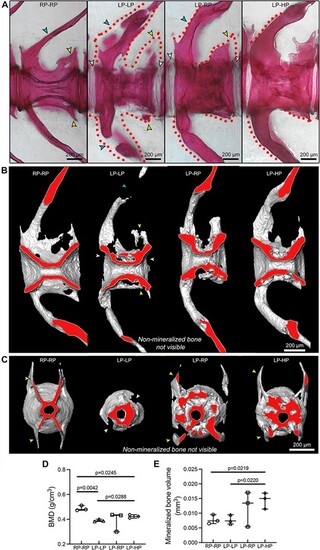
3D assessment of the LP-driven increase in bone matrix volume that subsequently mineralizes with sufficient-P intake. (A) Whole-mount Alizarin red S staining shows that LP–LP vertebrae present several non-mineralized (dotted lines, negative for the staining) bone structures compared to controls (RP–RP), i.e. the vertebral body endplates (white arrowheads), neural and haemal arches (turquoise arrowheads), and zygapophysis (yellow arrowheads). These structures are almost fully mineralized when sufficient dietary P is provided, as shown in LP–RP and LP–HP zebrafish. Virtual sagittal (B) and cross (C) sections from micro-CT-based reconstructions of vertebral bodies show the mineralization portion of bone only. The virtual sectional plane labeled in red shows the increased amount of bone around the vertebral centrum in LP–LP, LP–RP, and LP–HP zebrafish compared to controls. Gaps in bone structures are non-mineralized bone structures that are not visible with micro-CT. Arrowheads as in A. (D and E) Micro-CT analysis of the mineralized parts of bone. (D) BMD is reduced in LP–LP and LP–HP zebrafish compared to controls. (E) A dietary P-dependent increase in the bone volume (mineralized bone only) is demonstrated in LP–HP compared to control and LP–LP zebrafish. Values are reported with Box and Whisker plots: the midline in each box is indicative of the median, whereas min and max values are shown with whiskers. Individual data points and P values are shown. |
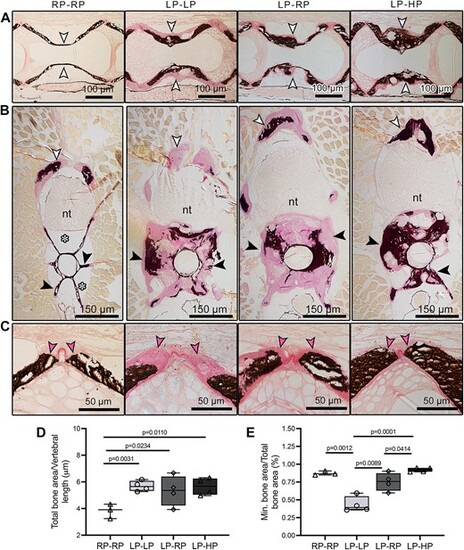
2D assessment of the LP-driven increase in bone matrix volume that subsequently mineralizes with sufficient-P intake. Sagittal (A and C) and cross (B) non-demineralized histological sections of the vertebral column stained with Von Kossa/Van Gieson. Compared to controls, LP–LP, LP–RP, and LP–HP animals show an increase in bone volume in the middle region of the vertebral centrum (white arrowheads in A, black arrowheads in B), at the arches (white arrowheads in B), and at the vertebral body endplates (pink arrowheads, C). In LP–LP animals, the amount of non-mineralized bone matrix (pink staining) is larger compared to that in LP–RP and LP–HP animals, where the bone structures are mineralized (black staining). In all zebrafish with LP dietary history, the enlarged bone fills the space occupied by fat in RP–RP (white asterisks). Nt: neural tube. (D and E) Histology-based measurements. (D) The total bone area (mineralized and non-mineralized) at the vertebral body endplates, normalized to vertebral body length, is significantly increased by 1.5-fold in LP–LP, LP–RP, and LP–HP zebrafish compared to controls (RP–RP). (E) At the vertebral body endplates, the mineralized bone area divided by the total bone area, used as indicator of mineralization, shows that bone mineralization depends on dietary P, and non-mineralized bone generated during the LP period can resume mineralization to an extent similar to controls when sufficient-P is provided with the diet. Values are reported with Box and Whisker plots: the midline in each box is indicative of the median, whereas min and max values are shown with whiskers. Individual data points and P values are shown. |
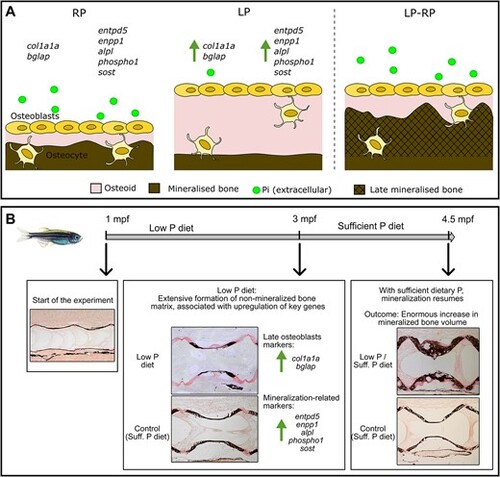
Schematic view of the effects of dietary P intake on bone formation and mineralization. (A) In presence of regular dietary P (RP), the non-mineralized bone matrix secreted by osteoblasts, named osteoid, mineralizes after deposition. When low dietary P (LP) is provided, bone matrix production is stimulated, accompanied by the increased expression of the osteoblast specific markers collagen type I (col1a1a) and osteocalcin (bglap). Under LP conditions, genes important for bone mineralization are upregulated, such as the ectonucleotide pyrophosphatase phosphodiesterase 1 (enpp1), the ectonucleoside triphosphate/diphospho-hydrolase 5 (entpd5), the tissue non-specific alkaline phosphatase (alpl), the phosphatase orphan 1 (phospho1), and sclerostin (sost). Thus, under LP conditions, osteoblasts increase the production of non-mineralized bone matrix and the expression of genes required for mineralization. When sufficient dietary P is provided (LP–RP), the mineralization of the non-mineralized matrix resumes, resulting in increased mineralized bone volume. (B) Summary of the main results of the zebrafish dietary P experiment. The LP diet stimulates bone matrix formation first associated to upregulation of key genes. Upon sufficient dietary P administration, newly formed bone matrix mineralizes, resulting in enormous increase in mineralized bone volume. |