
|
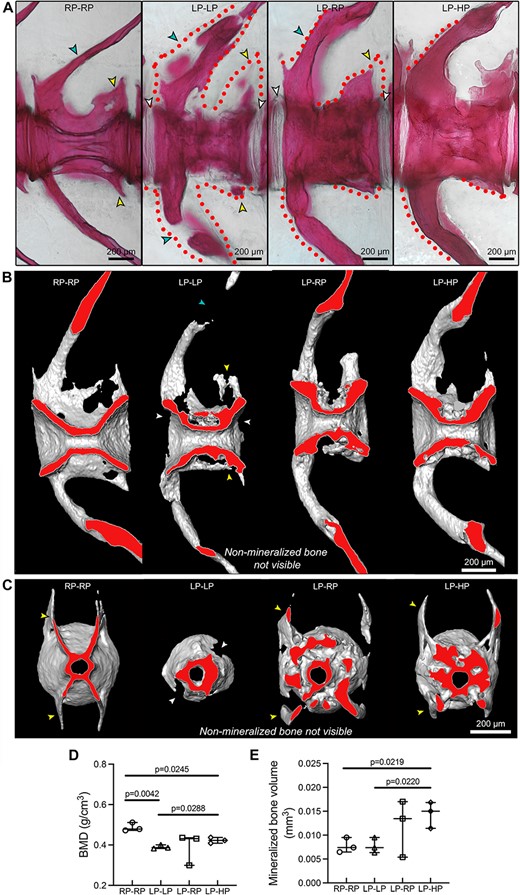
Fig. 4 3D assessment of the LP-driven increase in bone matrix volume that subsequently mineralizes with sufficient-P intake. (A) Whole-mount Alizarin red S staining shows that LP–LP vertebrae present several non-mineralized (dotted lines, negative for the staining) bone structures compared to controls (RP–RP), i.e. the vertebral body endplates (white arrowheads), neural and haemal arches (turquoise arrowheads), and zygapophysis (yellow arrowheads). These structures are almost fully mineralized when sufficient dietary P is provided, as shown in LP–RP and LP–HP zebrafish. Virtual sagittal (B) and cross (C) sections from micro-CT-based reconstructions of vertebral bodies show the mineralization portion of bone only. The virtual sectional plane labeled in red shows the increased amount of bone around the vertebral centrum in LP–LP, LP–RP, and LP–HP zebrafish compared to controls. Gaps in bone structures are non-mineralized bone structures that are not visible with micro-CT. Arrowheads as in A. (D and E) Micro-CT analysis of the mineralized parts of bone. (D) BMD is reduced in LP–LP and LP–HP zebrafish compared to controls. (E) A dietary P-dependent increase in the bone volume (mineralized bone only) is demonstrated in LP–HP compared to control and LP–LP zebrafish. Values are reported with Box and Whisker plots: the midline in each box is indicative of the median, whereas min and max values are shown with whiskers. Individual data points and P values are shown.