
- Title
-
CUT&Tag applied to zebrafish adult tail fins reveals a return of embryonic H3K4me3 patterns during regeneration
- Authors
- Duong, P., Rodriguez-Parks, A., Kang, J., Murphy, P.J.
- Source
- Full text @ Epigenetics Chromatin

CUT&Tag detects H3K4me3 at the promoter sites of annotated genes in zebrafish caudal fin. a The schematic workflow of CUT&Tag applied to zebrafish fins. b Genome browser view of H3K4me3 enrichment at select loci. H3K4me3 is detected at the transcription start site (TSS) of three genes with roles in development (hoxa gene cluster). c Scatter plots displaying the pairwise correlation between the Uninjured (0 dpa) H3K4me3 replicates. Correlations are indicative of a Pearson test |
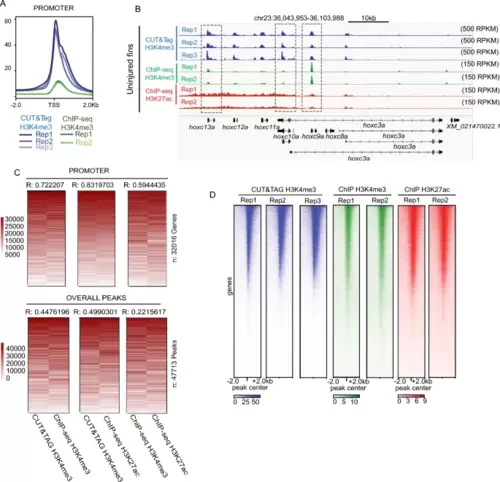
Correlations between H3K4me3 enrichment detected by CUT&Tag and ChIP-seq from the zebrafish caudal fins. a Profile plots of H3K4me3 and chromatin modification enrichment at promoter regions in zebrafish fins using CUT&Tag and ChIP-seq. b Genome browser view of H3K4me3 CUT&Tag, H3K4me3 ChIP-seq, and H3K27ac ChIP-seq enrichment at select loci. All three signal types are detected at the TSS of several hoxc genes. c Rank normalized correlation heatmaps between ChIP-Seq and CUT&Tag enrichment over promoters and overall peak regions. Correlations are indicative of a Pearson test. d Heatmaps of individual Uninjured (0 dpa) replicate data for H3K4me3 from CUT&Tag, H3K4me3 from ChIP-seq, and H3K27ac from ChIP-seq, enrichment at the TSS of annotated genes |

CUT&Tag detects H3K4me3 at the TSS of annotated genes in regenerating (2 dpa) amputated zebrafish fin. a Heatmap of Pearson correlation values demonstrating significant correlation between uninjured (0 dpa) and regenerating fins (2 dpa) both within promoters and at peak regions. b Venn diagram depicting shared and unique H3K4me3 peaks between Uninjured (0 dpa), and Regeneration (2 dpa) zebrafish caudal fins samples. c Profile plots of H3K4me3 and chromatin accessibility enrichment at classified peak regions (Common, Uninjured (0 dpa), and Regeneration (2 dpa)). d Gene ontology analysis of classified H3K4me3 marked regions, including Common, Uninjured (0 dpa), and Regeneration (2 dpa) specific regions based on Venn diagram. e Volcano plot of H3K4me3 enrichment changes comparing uninjured and regenerating fin (significance thresholds = absolute Log2FC > 0.5 and adjusted p-value < 0.05). f Gene ontology analysis of H3K4me3 changes in 2 dpa-specific region with at least 0.05 FDR based on DESeq2 result. g Genome browser view showing enrichment of H3K4me3 at putative regulatory elements for selected genes in Uninjured (0 dpa), and Regeneration (2 dpa) classes |

CUT&Tag correlates with the chromatin accessibility. a Pair-wise correlation plot showing comparisons between H3K4me3 samples and ATA-Seq samples, correlation from Pearson test. b Heatmap of CUT&Tag and ATAC enrichment (rank normalized) at promoters comparing between uninjured and regenerating tissues. Pearson correlations scores are provided. c Profile plots of H3K4me3 and chromatin accessibility enrichment at promoter-marked regions in zebrafish fins at Uninjured (0 dpa) and Regeneration (2 dpa). d Heatmap of H3K4me3 enrichment and chromatin accessibility enrichment surrounding gene promoters during fin regeneration. e Boxplots of chromatin accessibility change (Log2FC) at defined classes of H3K4me3 marked loci. All P-values are the results of Welch two-sample T-testing |

Enrichment for H3K4me3 in embryonic fins overlaps with H3K4me3 in regenerating fin samples. a Heatmap of enrichment (rank normalized) comparing adult fin and embryonic fin fold samples at promoter regions or overall H3K4me3 peaks. Correlations are indicative of a Pearson test. b Venn diagram classifying shared and unique H3K4me3 peaks between Development (24 hpf) fin fold samples, and samples from Uninjured (0 dpa) or Regeneration (2 dpa) zebrafish caudal fins. c Heatmap of H3K4me3 and chromatin accessibility enrichment surrounding peak regions. d Gene ontology analysis of classified H3K4me3 peak regions |

CUT&Tag for H3K4me3 correlates with RNA transcript abundance. a Profile plots of merged H3K4me3, chromatin accessibility, and RNA enrichment at gene promoters parsed based on changes in H3K4me3 during regeneration. b Boxplots of H3K4me3, and RNA enrichment at regions defined based on gene expression changes. c Boxplots of H3K4me3 change at the regions defined based on low and high ATAC peak cutoffs. d Gene ontology analysis of regions defined in panel a. e–g Genome browser view showing enrichment of H3K4me3 and gene expression (RNA transcript abundance) at the regulatory elements of selected genes. All P-values are the results of Welch two-sample T-testing |