
|
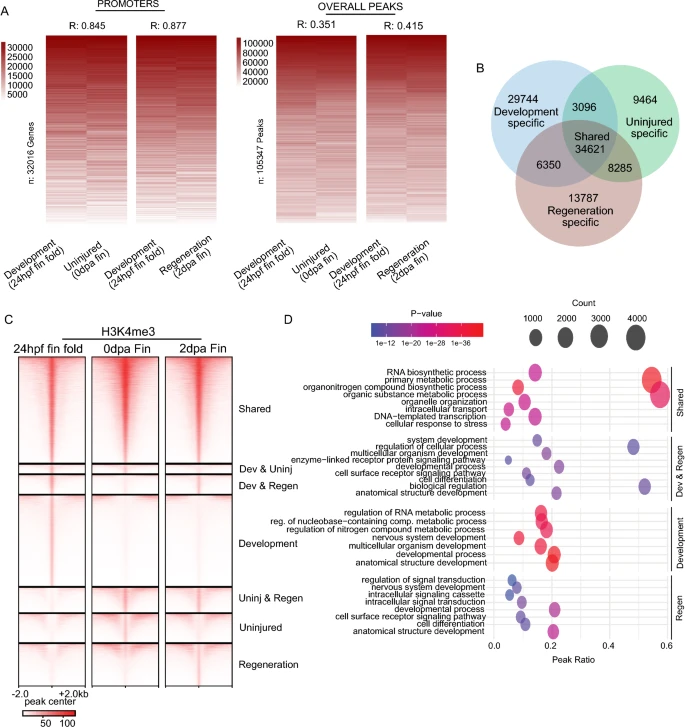
Fig. 5 Enrichment for H3K4me3 in embryonic fins overlaps with H3K4me3 in regenerating fin samples. a Heatmap of enrichment (rank normalized) comparing adult fin and embryonic fin fold samples at promoter regions or overall H3K4me3 peaks. Correlations are indicative of a Pearson test. b Venn diagram classifying shared and unique H3K4me3 peaks between Development (24 hpf) fin fold samples, and samples from Uninjured (0 dpa) or Regeneration (2 dpa) zebrafish caudal fins. c Heatmap of H3K4me3 and chromatin accessibility enrichment surrounding peak regions. d Gene ontology analysis of classified H3K4me3 peak regions