
|
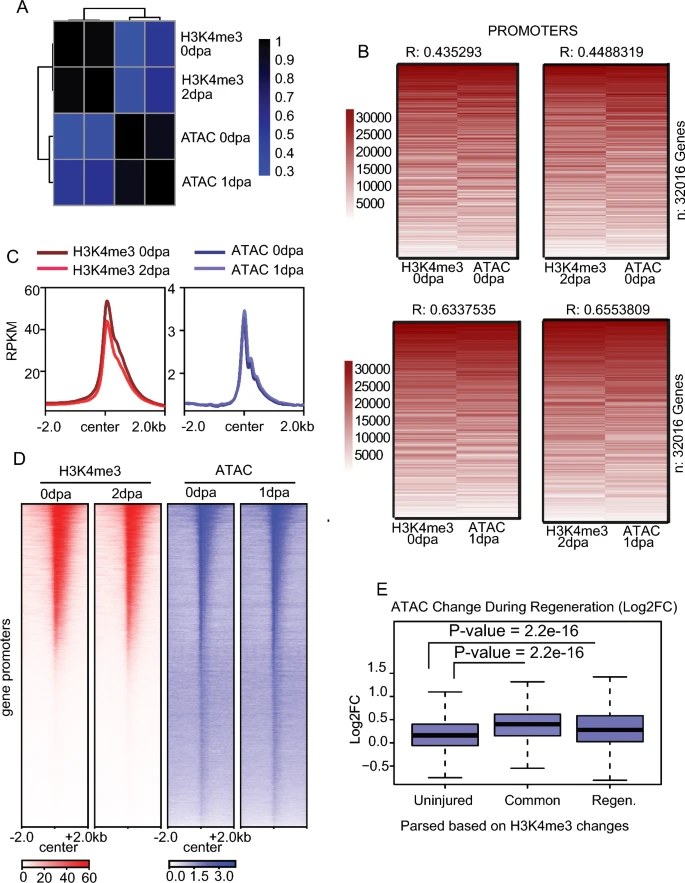
Fig. 4 CUT&Tag correlates with the chromatin accessibility. a Pair-wise correlation plot showing comparisons between H3K4me3 samples and ATA-Seq samples, correlation from Pearson test. b Heatmap of CUT&Tag and ATAC enrichment (rank normalized) at promoters comparing between uninjured and regenerating tissues. Pearson correlations scores are provided. c Profile plots of H3K4me3 and chromatin accessibility enrichment at promoter-marked regions in zebrafish fins at Uninjured (0 dpa) and Regeneration (2 dpa). d Heatmap of H3K4me3 enrichment and chromatin accessibility enrichment surrounding gene promoters during fin regeneration. e Boxplots of chromatin accessibility change (Log2FC) at defined classes of H3K4me3 marked loci. All P-values are the results of Welch two-sample T-testing