
|
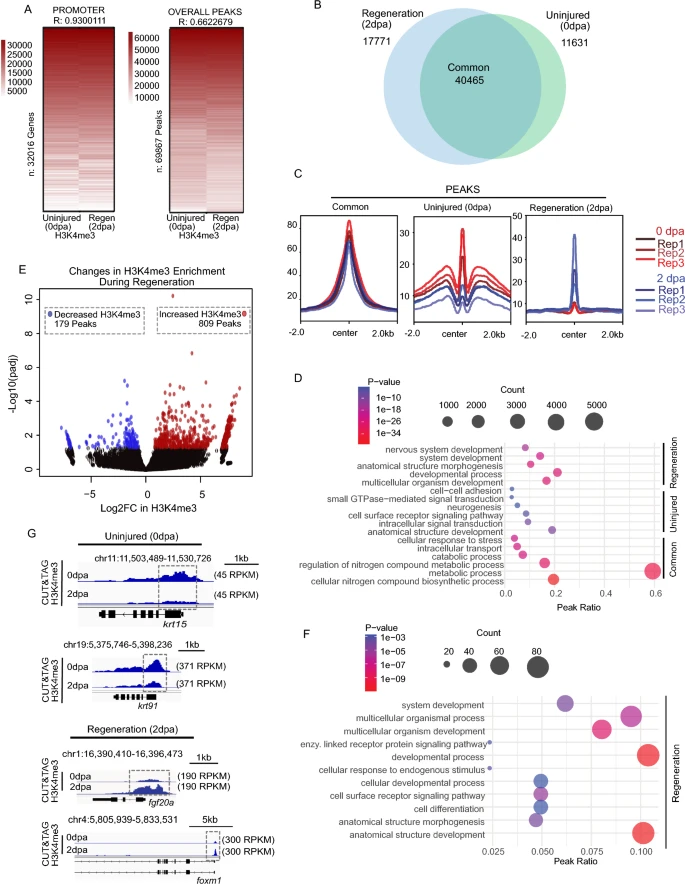
Fig. 3 CUT&Tag detects H3K4me3 at the TSS of annotated genes in regenerating (2 dpa) amputated zebrafish fin. a Heatmap of Pearson correlation values demonstrating significant correlation between uninjured (0 dpa) and regenerating fins (2 dpa) both within promoters and at peak regions. b Venn diagram depicting shared and unique H3K4me3 peaks between Uninjured (0 dpa), and Regeneration (2 dpa) zebrafish caudal fins samples. c Profile plots of H3K4me3 and chromatin accessibility enrichment at classified peak regions (Common, Uninjured (0 dpa), and Regeneration (2 dpa)). d Gene ontology analysis of classified H3K4me3 marked regions, including Common, Uninjured (0 dpa), and Regeneration (2 dpa) specific regions based on Venn diagram. e Volcano plot of H3K4me3 enrichment changes comparing uninjured and regenerating fin (significance thresholds = absolute Log2FC > 0.5 and adjusted p-value < 0.05). f Gene ontology analysis of H3K4me3 changes in 2 dpa-specific region with at least 0.05 FDR based on DESeq2 result. g Genome browser view showing enrichment of H3K4me3 at putative regulatory elements for selected genes in Uninjured (0 dpa), and Regeneration (2 dpa) classes