- Title
-
The PP2A regulator IER5L supports prostate cancer progression
- Authors
- Crespo, J.R., Martín-Martín, N., Garcia-Longarte, S., Corres-Mendizabal, J., Carlevaris, O., Astobiza, I., Zabala-Letona, A., Guiu, M., Azkargorta, M., Gonzalez-Lopez, M., Macías-Cámara, N., Doan, P., Elortza, F., Mendizabal, I., Westermack, J., Gomis, R.R., Ercilla, A., Carracedo, A.
- Source
- Full text @ Cell Death Dis.
|
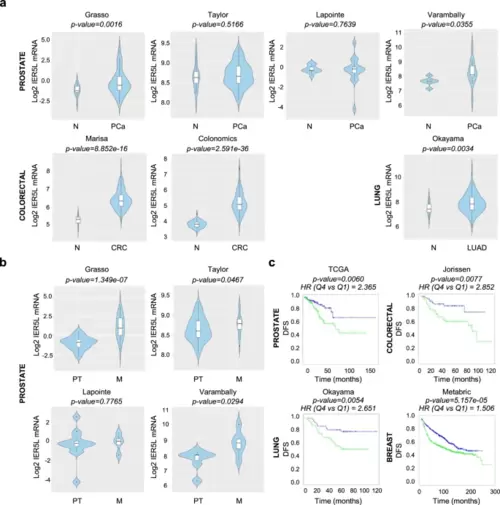
IER5L is upregulated in metastatic prostate cancer. a Violin plots depicting the Log2 expression of IER5L in non-tumoral (N), prostate cancer (PCa), lung adenocarcinoma (LUAD) and colorectal cancer (CRC) specimens in the indicated dataset. p-value derives from a Student’s t-test analysis between the indicated groups. b Violin plots showing the Log2 expression of IER5L mRNA in primary tumor (PT) and metastatic (M) PCa specimens. p-value derives from a Student’s t-test analysis between the indicated groups. c Kaplan-Meyer curves showing the association of IER5L mRNA expression to disease-free survival (DFS) in the indicated datasets. Quartile 1 (blue) and quartile 4 (green) are represented. A log-rank test p-value and the hazard ratio (HR) between two groups calculated by Cox proportional hazard model regression are provided above each graph |
|
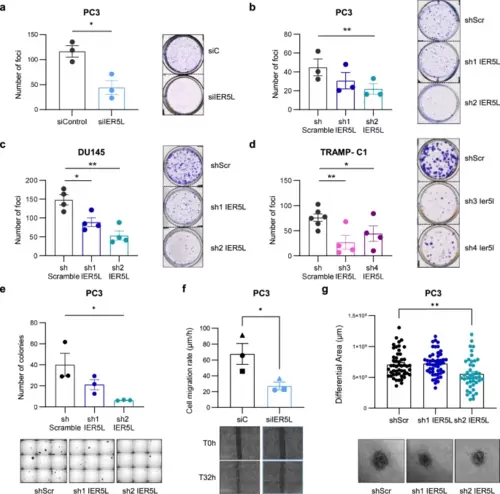
IER5L depletion reduces growth under stress, migration and invasion of prostate cancer cells. a Foci-formation analysis of PC3 cells transfected with the indicated siRNA. The number of foci is shown (left panels). Representative images are shown (right panels). A t-test was applied for statistical analysis (n = 3). siC: non-target siRNA. b–d Analysis of foci formation upon IER5L depletion with the indicated shRNAs. The number of foci is shown (left panels). Representative images are shown (right panels). A paired t-test was applied for statistical analysis (b n = 3; c, d n = 4). shScr: shScramble. e Analysis of anchorage-independent growth of PC3 cells transduced with the indicated shRNAs. The number of colonies is shown (left panel). Representative images are shown (right panel). A paired t-test was applied for statistical analysis (n = 3). f Cell migration rate of PC3 cells transfected with the indicated pool of siRNAs. The different biological replicates are indicated with unique dot shapes (top panel). Representative images of the scratch at time (T) 0 and 32 hours (h) are shown (bottom panel). Two days after siRNA transfection were defined as the initial timepoint for the assay. A two-tailed paired t-test was applied for statistical analysis (n = 3). g Quantification of the invasive growth of PC3 cells embedded in collagen. The diameter of the spheroids was measured at 0 and 72-h and the differential area was calculated (top panel). Representative images of the spheroids at final timepoint are shown (bottom panel). A two-tailed unpaired t-test was applied for statistical analysis (n = 4). |
|
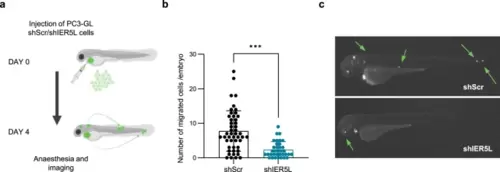
Prostate cancer cell dissemination is compromised upon IER5L depletion in zebrafish. a Representation of the experimental design of the in vivo cell dissemination assay in zebrafish. PC3 GFP-Luc (GL) cells transduced with shScramble (shScr) or sh2 IER5L (shIER5L) were injected into the pericardial cavity of zebrafish embryos. Cell dissemination was analyzed at 4 days post injection. The number of disseminated cells (b) and a representative image (c) are shown. A two-tailed Mann–Whitney test was applied for statistical analysis. |
|
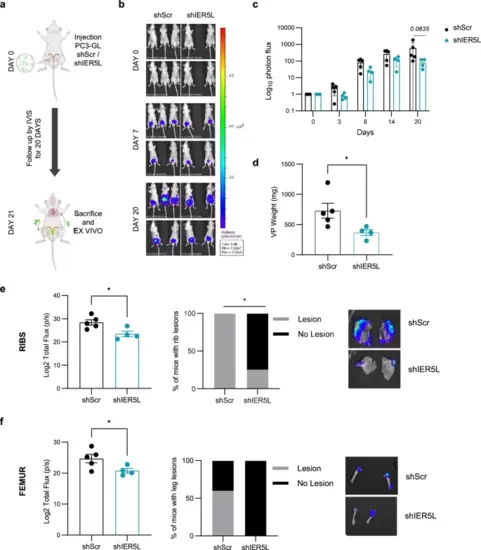
Silencing of IER5L counteracts cell growth and metastatic dissemination of prostate cancer cells in vivo. a Experimental design of the in vivo orthotopic assay. PC3 GFP-LUC (GL) cells transduced with shScramble (shScr) or sh2 IER5L (shIER5L) were injected into the ventral prostate lobe of nude mice and followed up for 20 days. IVIS relative flux data along the experimental process. Representative images (b) and the total photon flux normalized to time 0 (c) are represented. A multiple Mann-Whitney U-test was applied for statistical analysis. d Ex vivo tumor weight of the ventral lobes of prostates (VP) from the in vivo orthotopic assay. A two-tailed Mann-Whitney test was applied for statistical analysis. Ex vivo IVIS signal quantification of ribs (e) and femur (f) (left panels). Contingency analysis of metastatic lesions at those sites (middle panels) and a representative image (right panels) are shown. A one-tailed Mann–Whitney test and a Fisher exact t-test were used, respectively. |
|
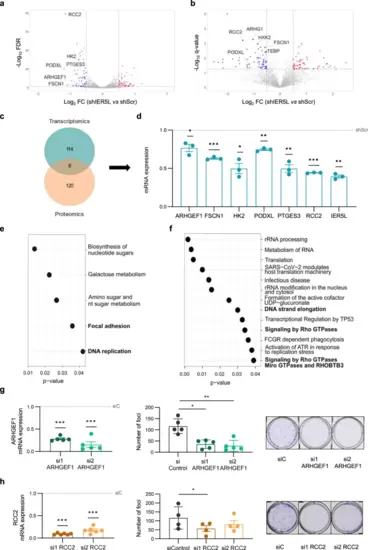
IER5L depletion targets DNA replication and monomeric G protein pathways. Volcano plot representation of the differentially expressed genes (DEGs) (a) and proteins (b) upon IER5L silencing by shScramble (shScr) or sh2 IER5L (shIER5L) transduction. The common targets between the RNAseq and proteomics’ analyses are highlighted. c Venn diagram summarizing the number of DEGs and the proteins affected by IER5L depletion in the RNAseq and proteomics experiments from (a) and (b). d Analysis of the expression of the indicated genes by qRT-PCR upon IER5L depletion by sh2 IER5L transduction in PC3 cells. The mRNA levels are normalized to GAPDH and shScr. The dotted line represents the normalized value of the shScr data. A one-sample t-test was applied for statistical analysis (n = 3). Functional enrichment analysis of the DEGs upon IER5L silencing by KEGG (e) and Reactome (f). Left panels: Analysis of ARHGEF1 (g) and RCC2 (h) mRNA expression by qRT-PCR. The levels are normalized to GAPDH and non-target (siC) condition. The dotted line represents the normalized value of the siC data. A one-sample t-test was applied for statistical analysis (n = 5 and n = 6 respectively). Middle panels: Analysis of foci formation upon ARHGEF1 (g) and RCC2 (h) depletion. The number of foci is shown. A paired t-test was applied for statistical analysis (n = 5 and n = 4 respectively). Right panels: Representative images of the foci experiments are shown. |
|
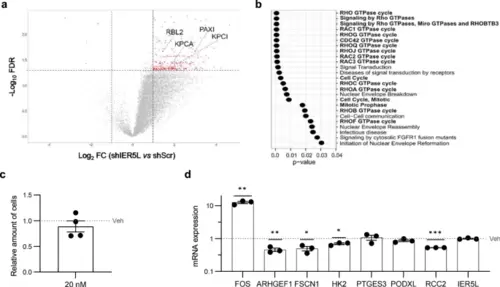
IER5L depletion elicits molecular alterations consistent with PP2A regulation. a Volcano plot representation of the phosphopeptides altered upon IER5L silencing by shScramble (shScr) or sh2 IER5L (shIER5L) transduction. The proteins inferred from the altered phosphopeptides that are reported targets of PP2A are highlighted. b Functional enrichment analysis of the proteins inferred from the differentially phosphorylated peptides upon IER5L silencing by Reactome. c Analysis of crystal violet staining after a 24-h treatment with 20 nM okadaic acid. The absorbance was normalized to Vehicle (Veh). A one-sample t-test was applied for statistical analysis (n = 4). d Analysis of the expression of the indicated genes by qRT-PCR upon a 24-h treatment with 20 nM okadaic acid. The levels are normalized to GAPDH and Vehicle (Veh). The dotted line represents the normalized value of the Veh data. A one-sample t-test was applied for statistical analysis (n = 3). |

