
Fig. 5
- ID
- ZDB-FIG-240722-5
- Publication
- Crespo et al., 2024 - The PP2A regulator IER5L supports prostate cancer progression
- Other Figures
- All Figure Page
- Back to All Figure Page
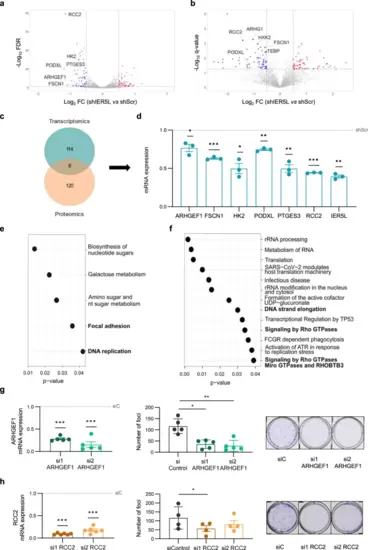
IER5L depletion targets DNA replication and monomeric G protein pathways. Volcano plot representation of the differentially expressed genes (DEGs) (a) and proteins (b) upon IER5L silencing by shScramble (shScr) or sh2 IER5L (shIER5L) transduction. The common targets between the RNAseq and proteomics’ analyses are highlighted. c Venn diagram summarizing the number of DEGs and the proteins affected by IER5L depletion in the RNAseq and proteomics experiments from (a) and (b). d Analysis of the expression of the indicated genes by qRT-PCR upon IER5L depletion by sh2 IER5L transduction in PC3 cells. The mRNA levels are normalized to GAPDH and shScr. The dotted line represents the normalized value of the shScr data. A one-sample t-test was applied for statistical analysis (n = 3). Functional enrichment analysis of the DEGs upon IER5L silencing by KEGG (e) and Reactome (f). Left panels: Analysis of ARHGEF1 (g) and RCC2 (h) mRNA expression by qRT-PCR. The levels are normalized to GAPDH and non-target (siC) condition. The dotted line represents the normalized value of the siC data. A one-sample t-test was applied for statistical analysis (n = 5 and n = 6 respectively). Middle panels: Analysis of foci formation upon ARHGEF1 (g) and RCC2 (h) depletion. The number of foci is shown. A paired t-test was applied for statistical analysis (n = 5 and n = 4 respectively). Right panels: Representative images of the foci experiments are shown. |