
|
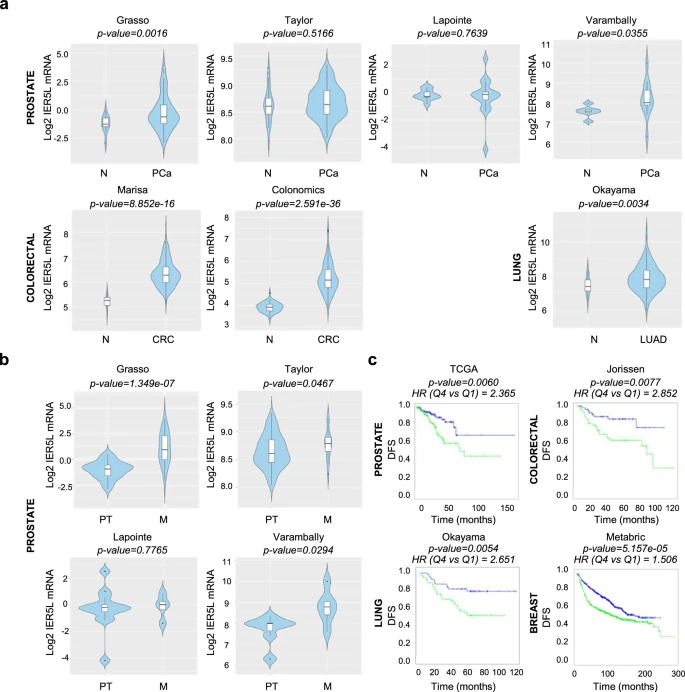
Fig. 1 IER5L is upregulated in metastatic prostate cancer. a Violin plots depicting the Log2 expression of IER5L in non-tumoral (N), prostate cancer (PCa), lung adenocarcinoma (LUAD) and colorectal cancer (CRC) specimens in the indicated dataset. p-value derives from a Student’s t-test analysis between the indicated groups. b Violin plots showing the Log2 expression of IER5L mRNA in primary tumor (PT) and metastatic (M) PCa specimens. p-value derives from a Student’s t-test analysis between the indicated groups. c Kaplan-Meyer curves showing the association of IER5L mRNA expression to disease-free survival (DFS) in the indicated datasets. Quartile 1 (blue) and quartile 4 (green) are represented. A log-rank test p-value and the hazard ratio (HR) between two groups calculated by Cox proportional hazard model regression are provided above each graph