
- Title
-
A unified approach to investigating 4 dpf zebrafish larval behaviour through a standardised light/dark assay
- Authors
- Hillman, C., Kearn, J., Parker, M.O.
- Source
- Full text @ Prog. Neuropsychopharmacol. Biol. Psychiatry
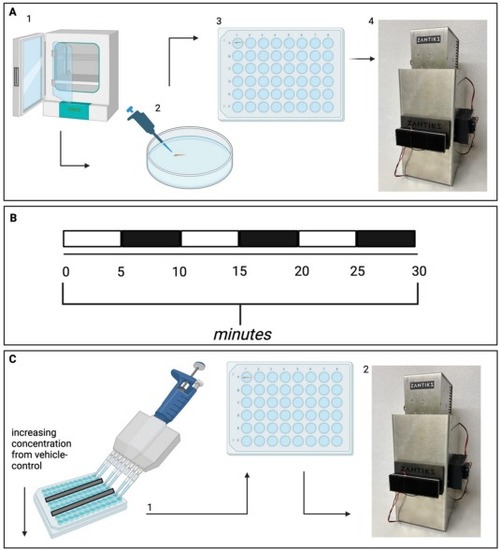
The experimental protocol for the standardised light/dark assay including drug exposure procedures. (A) the fish are transferred from the incubator to a 48 well plate and placed in the behavioural unit with the lights on for 30-min of acclimation prior to the recording. (B) Breakdown of the L/D (light/dark) recording which incorporates 5-min light phase to dark phase transitions for 30-min. (C) Overview of drug exposure procedure from a 96-well dosing plate to the fish. Behaviour was then monitored using a Zantiks MWP unit. |
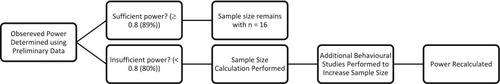
Flow chart depicting the power analysis and sample size determination procedure for larval zebrafish drug exposures. |
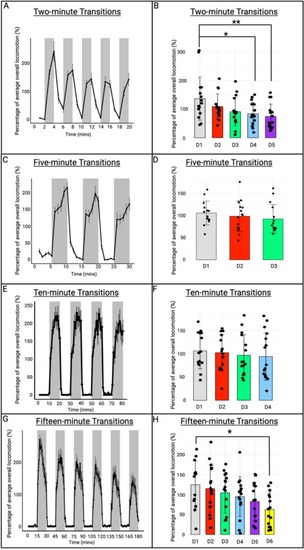
Effect of varying light and dark phase length on larval behavioural response. Light/dark locomotion displayed as a percentage of baseline response are represented in minutes for (A) two-minute transitions (C) five-minute transitions (E) ten-minute transitions and (G) fifteen-minute transitions. The mean dark phase responses are numbered as D1-D6 for (B) two-minute transitions, (D) five-minute transitions, (F) ten-minute transitions and (H) fifteen-minute transitions. |
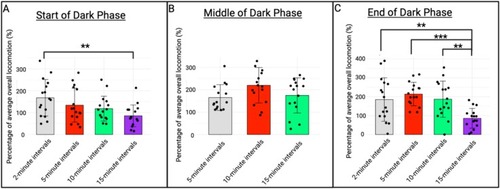
Time-dependent effects of varying light and dark phase length on larval behavioural responses. Locomotion displayed as a percentage of baseline response represented as mean dark phase responses for (A) the first minute of each dark phase (B) the median minute of each dark phase and (C) the final minute of each dark phase for the two-minute, five-minute, ten-minute and fifteen-minute transition protocols. |
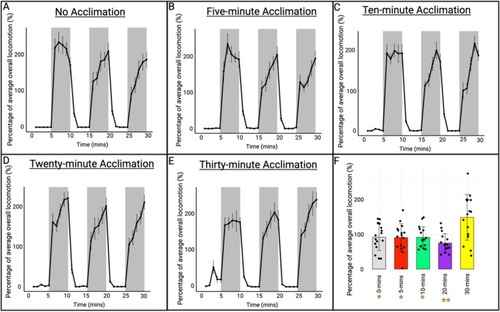
The light/dark response is affected by acclimation period length. The light/dark mean locomotor responses represented in minutes for (A) no acclimation, (B) five-minute acclimation in the light, (C) ten-minute acclimation in the light, (D) 20-min acclimation in the light and (E) 30-min acclimation in the light. (F) represents the mean dark phase locomotor responses for each acclimation period length. |
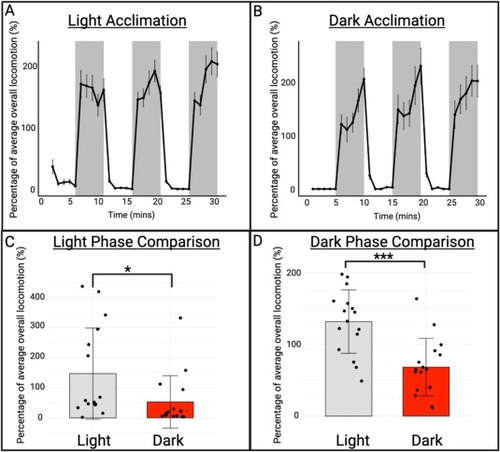
Lighting conditions in the acclimation period affect the subsequent light/dark assay behavioural response. Larvae were acclimated in the light (A) or dark (B) for 30 min and then underwent the standardised light/dark assay ( Section 2.3 of this paper). |
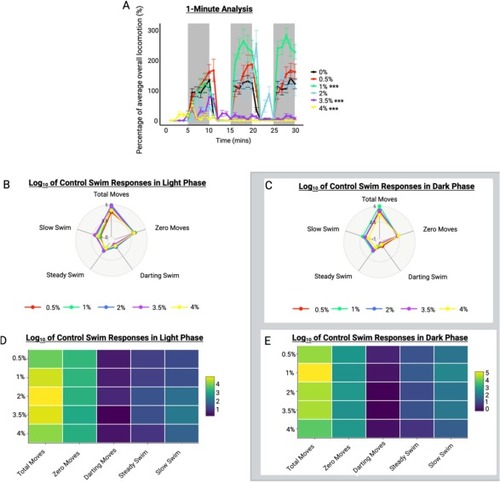
Concentration-dependent effects of ethanol on larval behaviour in the light/dark assay. The minute analysis (A) is represented as mean percentage of baseline movement over the 30-min recording period. The heat map (B) and radar chart (D) show light phase responses and (C) and (E) show dark phase responses. |
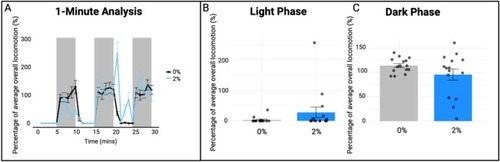
Unchanged light phase responsiveness with exposure to 2.0% ethanol in zebrafish larvae. The minute analysis (A) and light vs dark average (B and C) are represented as mean percentage of baseline movement over the 30-min recording period. |

Time-dependent effects of ethanol exposure on larval light/dark behaviour. Mean locomotor responses represented as a percentage of baseline movement for (A and B) light and dark phase one (0–10-min post-exposure), (C and D) light and dark phase two (10–20-min post-exposure) and (E and F) light and dark phase three (20–30-min post-exposure). |
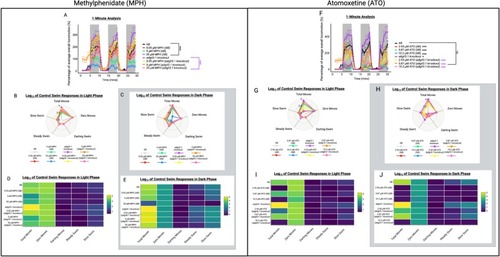
The effects of AB wild type and transgenic adgrl3.1−/− larval phenotypes on light/dark locomotion as well as the potential for assessing therapeutic agents. The minute analyses (A and F) are represented as mean percentage of baseline movement over the 30-min recording period. The heat maps (B and G) and radar charts (D and I) show light phase responses and (C and H) and (E and J) show dark phase responses. |