
Image
|
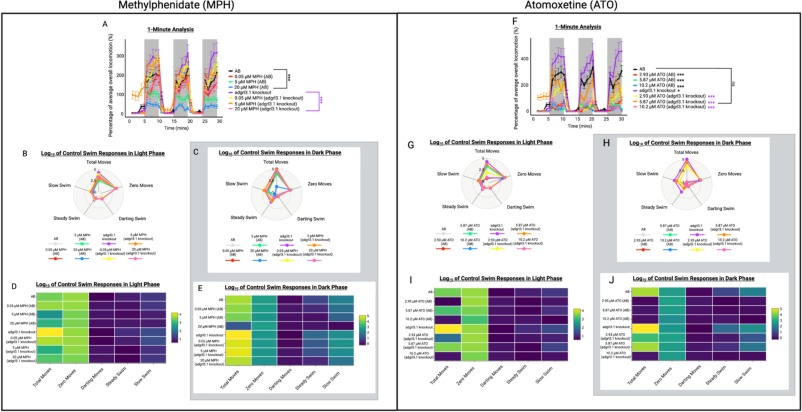
Figure Caption
Fig. 10 The effects of AB wild type and transgenic adgrl3.1−/− larval phenotypes on light/dark locomotion as well as the potential for assessing therapeutic agents. The minute analyses (A and F) are represented as mean percentage of baseline movement over the 30-min recording period. The heat maps (B and G) and radar charts (D and I) show light phase responses and (C and H) and (E and J) show dark phase responses.
Acknowledgments
This image is the copyrighted work of the attributed author or publisher, and
ZFIN has permission only to display this image to its users.
Additional permissions should be obtained from the applicable author or publisher of the image.
Full text @ Prog. Neuropsychopharmacol. Biol. Psychiatry