
FIGURE
Fig. 3
Fig. 3
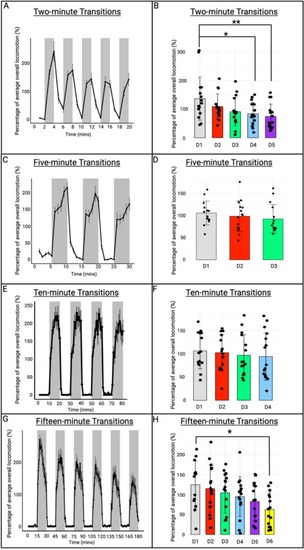
Effect of varying light and dark phase length on larval behavioural response. Light/dark locomotion displayed as a percentage of baseline response are represented in minutes for (A) two-minute transitions (C) five-minute transitions (E) ten-minute transitions and (G) fifteen-minute transitions. The mean dark phase responses are numbered as D1-D6 for (B) two-minute transitions, (D) five-minute transitions, (F) ten-minute transitions and (H) fifteen-minute transitions. |
Expression Data
Expression Detail
Antibody Labeling
Phenotype Data
Phenotype Detail
Acknowledgments
This image is the copyrighted work of the attributed author or publisher, and
ZFIN has permission only to display this image to its users.
Additional permissions should be obtained from the applicable author or publisher of the image.
Full text @ Prog. Neuropsychopharmacol. Biol. Psychiatry