
FIGURE
Fig. 7
Fig. 7
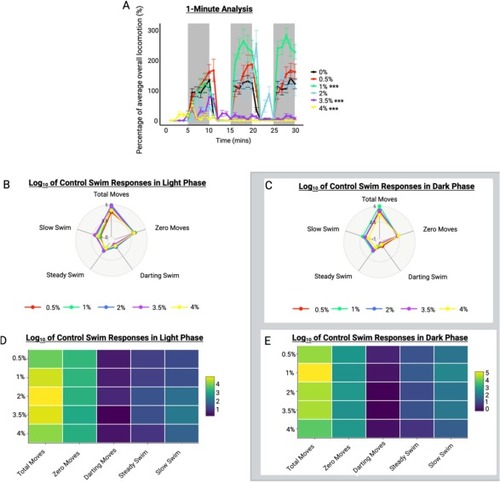
Concentration-dependent effects of ethanol on larval behaviour in the light/dark assay. The minute analysis (A) is represented as mean percentage of baseline movement over the 30-min recording period. The heat map (B) and radar chart (D) show light phase responses and (C) and (E) show dark phase responses. |
Expression Data
Expression Detail
Antibody Labeling
Phenotype Data
Phenotype Detail
Acknowledgments
This image is the copyrighted work of the attributed author or publisher, and
ZFIN has permission only to display this image to its users.
Additional permissions should be obtained from the applicable author or publisher of the image.
Full text @ Prog. Neuropsychopharmacol. Biol. Psychiatry