
- Title
-
Hypomyelinated vps16 Mutant Zebrafish Exhibit Systemic and Neurodevelopmental Pathologies
- Authors
- Banerjee, S., Bongu, S., Hughes, S.P., Gaboury, E.K., Carver, C.E., Luo, X., Bessert, D.A., Thummel, R.
- Source
- Full text @ Int. J. Mol. Sci.
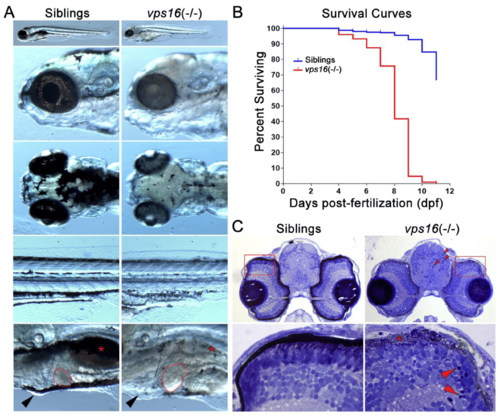
vps16(-/-) mutants can be phenotypically distinguished from wild-type siblings. (A) Images of wild-type sibling (left) and vps16(-/-) (right) larvae displaying distinctive pigmentation patterns at 7 dpf. Sibling larva (left) with characteristic darkly pigmented melanophore in RPE layer within eye and darkly pigmented melanophore aggregates on top of head and near yolk sac extension on side of body. Location of normally pigmented swim bladder (red asterisk), size of liver (outlined in red), and absence of edema (black arrowhead) shown in sibling larvae. vps16(-/-) mutant larva (right) showing severe hypopigmentation in RPE and reduced pigmentation on head and near yolk sac extension. vps16(-/-) mutant displaying hypopigmented and reduced swim bladder (red asterisk), hepatomegaly (outlined in red), and pericardial edema (black arrowhead). (B) Survival curve of siblings (blue) and vps16(-/-) mutants (red) depicting death of all mutants by 11 dpf. (C) Histological sections of 7 dpf sibling and vps16(-/-) larval forebrain near optic nerve showing pyknotic nuclei in mutant brain and retina (red arrowheads). vps16(-/-) larval retina shows degeneration and absence of pigmented RPE and truncated photoreceptors (asterisks) and lack of distinct organization of photoreceptor outer segments. |
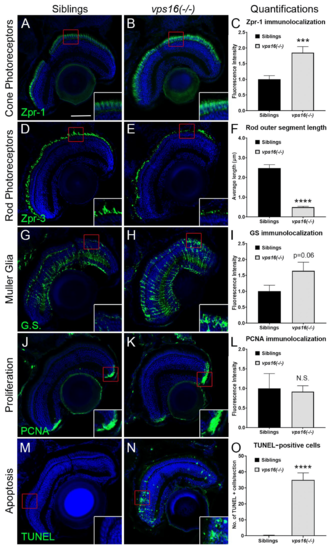
vps16(-/-) mutants at 7 dpf show retinal pathology including photoceptor degeneration, reactive gliosis of Müller glia (MG), and cell death. (A,B) Immunolocalization of Arrestin (Zpr-1) (green) in double cone photoreceptors. (A) Siblings (n = 15) show normal Zpr-1 immunolabeling in perinuclear domain of red/green double cones. (B) Zpr-1 immunolabeling observed throughout cytoplasm of hypertrophied and degenerating cones in vps16(-/-) mutants (n = 18). (C) Graph representing quantification of Zpr-1 immunolocalization in 7 dpf siblings and vps16(-/-) mutants. *** p = 0.0009. (D,E) Immunolocalization of Zpr-3 (green) in outer segments of rod photoreceptors. (D) Outer segments of healthy rod photoreceptors in siblings (n = 13) show normal length and structure. (E) Truncated outer segments of degenerating rod photoreceptors observed in vps16(-/-) mutants (n = 11). (F) Graph representing quantification of average length of rod outer segments immunolabeled with Zpr-3 in 7 dpf siblings and vps16(-/-) mutants. **** p < 0.0001. (G,H) Immunolocalization of glutamine synthetase (G.S.) (green) in MG. (G) Normal levels of G.S. immunolabeling in outer regions of MG of siblings (n = 14). (H) G.S. immunolabeling in ends of MG in outer retina showing reactive gliosis in vps16(-/-) mutants (n = 18). (I) Graph representing quantification of G.S. immunolocalization in 7 dpf siblings and vps16(-/-) mutants. p = 0.06. (J,K) Immunolocalization of PCNA-positive retinal progenitors (green) in CMZ. (J) PCNA-positive retinal progenitors shown in CMZ of siblings (n = 9). (K) Normal population of PCNA-positive retinal progenitors shown in CMZ of vps16(-/-) mutants (n = 8). (L) Graph representing quantification of PCNA immunolocalization in retinal CMZ of 7 dpf siblings and vps16(-/-) mutants. “N.S.” = not significant. (M–O) TUNEL-positive cells (green) in retinal sections. (M) Minimal to no TUNEL-positive apoptotic cells seen in sibling retina (n = 16). (N) Large number of TUNEL-positive apoptotic cells observed in vps16(-/-) mutant retina (n = 16), specifically in outer nuclear layer. (O) Graph representing quantification of average number of TUNEL-positive apoptotic cells in retinal sections of 7 dpf siblings and vps16(-/-) mutants. **** p < 0.0001. Scale bar in panel A = 50 microns for all images. Blue = TO-PRO-3, a nuclear stain. Error bars indicate SEM. |
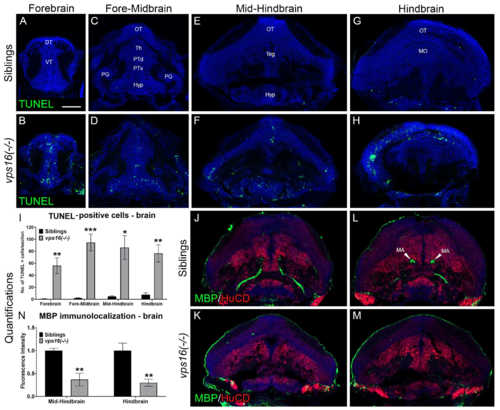
vps16(-/-) mutants show significant cell death and hypomyelination by 7 dpf. (A–I) TUNEL assay performed on brain sections of 7 dpf sibling and vps16(-/-) mutant larvae. Brain sections identified and sub-categorized in four regions: (A,B) forebrain, (C,D) fore-midbrain, (E,F) mid-hindbrain, and (G,H) hindbrain. (A,C,E,G) Minimal to no TUNEL-positive apoptotic cells (green) seen in sibling brain regions (n: 10 forebrain, 7 fore-midbrain, 9 mid-hindbrain, 4 hindbrain). (B,D,F,H) Numerous TUNEL-positive apoptotic cells (green) seen in vps16(-/-) mutant brain regions (n = 10 forebrain, p = 0.0022; n = 7 fore-midbrain, p = 0.0005; n = 5 mid-hindbrain, p = 0.0146; n = 7 hindbrain, p = 0.0027). (I) Graph representing quantification of average number of TUNEL-positive apoptotic cells in specific brain regions of 7 dpf siblings and vps16(-/-) mutants. (J–N) Immunolocalization of MBP (myelin, green) and HuCD (neurons, red) in brain section from two regions of sibling and vps16(-/-) mutant larvae: (J,K) mid-hindbrain and (L,M) hindbrain. (J–L) MBP immunolocalizes to Mauthner axons in mid-hindbrain (n = 6) and hindbrain (n = 6) regions of sibling brain. (K,M) MBP immunolocalization in mid-hindbrain (n = 6, p = 0.0048) and hindbrain (n = 6, p = 0.0061) regions of vps16(-/-) mutant brain showing decrease in myelin content. (N) Graph representing quantification of MBP immunolocalization in specific brain regions of 7 dpf siblings and vps16(-/-) mutants. Scale bar in panel A = 50 microns for all images. Blue = TO-PRO-3, nuclear stain. Error bars indicate SEM. * p < 0.05, ** p < 0.01, *** p < 0.001. |
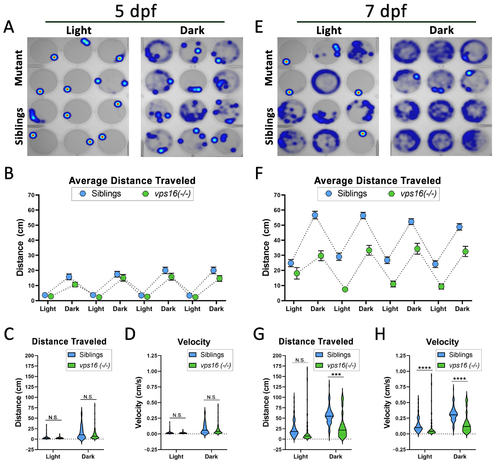
vps16(-/-) mutants show normal distance traveled at 5 dpf and significantly reduced distance traveled at 7 dpf in response to alternating cycles of light and dark. (A) Representative heatmap images of total distance moved by individual vps16(-/-) larvae at 5 dpf (mutants = top two rows, siblings = bottom two rows) during 3 min period of light and dark. (B) Graph representing average distance traveled by vps16(-/-) larvae at 5 dpf in 4 alternating light/dark cycles of 3 min each (siblings in blue; mutants in green). (C) Graph representing average distance traveled by siblings (blue, n = 71) and vps16(-/-) (green, n = 72) in light and dark periods. (D) Graph representing average velocity of siblings (blue, n = 71) and vps16(-/-) (green, n = 72) in light and dark periods. (E) Representative heatmap images of total distance moved by individual vps16(-/-) larvae at 7 dpf (mutants = top two rows; siblings = bottom two rows) during 3 min period of light and dark. (F) Graph representing average distance traveled by vps16(-/-) larvae at 7 dpf in 4 alternating light/dark cycles of 3 min each (siblings in blue; mutants in green). (G) Graph representing average distance traveled by siblings (blue, n = 72) and vps16(-/-) (green, n = 72) in light and dark periods. (H) Graph representing average velocity of siblings (blue, n = 72) and vps16(-/-) (green, n = 72) in light and dark periods. For all graphs, “N.S.” = not significant, “***” = p < 0.001, “****” = p < 0.0001, and error bars indicate SEM. |
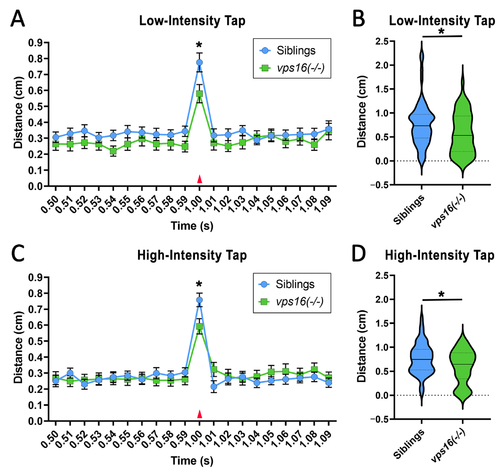
vps16(-/-) mutants at 7 dpf show significantly reduced distance traveled in response to single acoustic/tap stimulus at both low and high intensity. (A) Line graph representing average distance traveled by vps16(-/-) larvae (green, n = 56) and siblings (blue, n = 60) at 7 dpf in response to single low-intensity acoustic/tap stimulus (red arrow). (B) Violin plots representing average distance traveled by vps16(-/-) larvae (green, n = 56) and siblings (blue, n = 60) at 7 dpf in response to single low-intensity acoustic/tap stimulus. p < 0.05. (C) Line graph representing average distance traveled by vps16(-/-) larvae (green, n = 53) and siblings (blue, n = 58) at 7 dpf in response to single high-intensity acoustic/tap stimulus (red arrow). (D) Violin plots representing average distance traveled by vps16(-/-) larvae (green, n = 53) and siblings (blue, n = 58) at 7 dpf in response to single high-intensity acoustic/tap stimulus. For all graphs, “*” = p < 0.05 and error bars indicate SEM. PHENOTYPE:
|
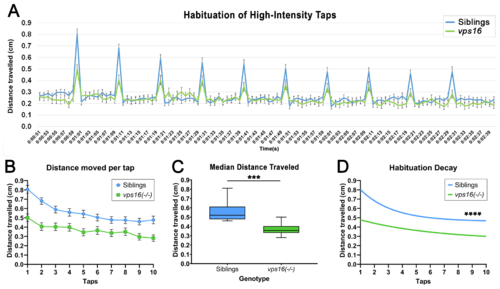
vps16(-/-) mutants at 7 dpf show significantly reduced habituation response to multiple high-intensity acoustic/tap stimuli compared with their siblings. (A) Line graph representing distance traveled by vps16 (-/-) larvae at 7 dpf during complete high-intensity multiple-tap paradigm comprising 10 high-intensity taps with 10 s interstimulus intervals (ISIs) (sibling in blue, vps16(-/-) in green). (B) Graph representing average distance moved by 7 dpf siblings (blue; n = 84) and vps16(-/-) (green; n = 78) larvae at each individual tap stimuli. (C) Box plots representing median distance traveled by 7 dpf siblings (blue; n = 84) and vps16(-/-) (green; n = 78) larvae in response to multiple-tap stimuli. “***” = p < 0.001. (D) First-order exponential decay curve representing average distance traveled by 7 dpf siblings (blue; n = 84) and vps16(-/-) (green; n = 78) larvae at each individual tap stimuli. “****” = p < 0.0001. Error bars indicate SEM PHENOTYPE:
|
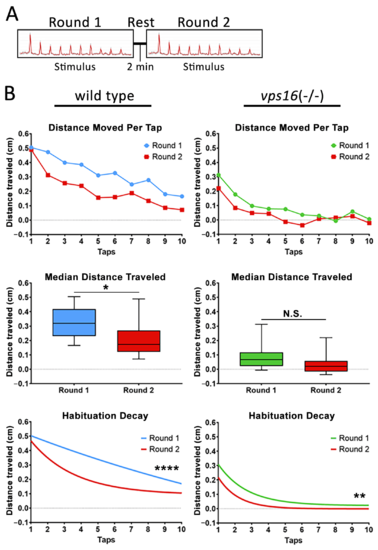
Both vps16(-/-) mutants and sibling larvae at 7 dpf show distinct habituation response post 2 min rest. (A) Schematic representation of intermediate memory paradigm showing round one stimulus having 10 high-intensity taps, followed by 2 min rest period with no stimulation, and finally round two stimulus having 10 high-intensity taps. (B) Line graph representing average distance traveled in response to each individual tap by 7 dpf siblings (blue, n = 105) and vps16(-/-) mutants (green, n = 107) before and after 2 min rest period (red). Box plots representing median distance traveled by 7 dpf siblings (blue, n = 105) and vps16(-/-) (green, n = 107) larvae in response to multiple-tap stimuli before and after 2 min rest period (red). First-order exponential decay curve representing average distance traveled in response to round one multiple-tap stimuli by 7 dpf siblings (blue, n = 105) and vps16(-/-) mutant (green, n = 107) larvae before and after 2 min rest period (red). For all graphs, “N.S.” = not significant, “*” = p < 0.05, “**” = p < 0.01, “****” = p < 0.0001, and error bars indicate SEM. PHENOTYPE:
|
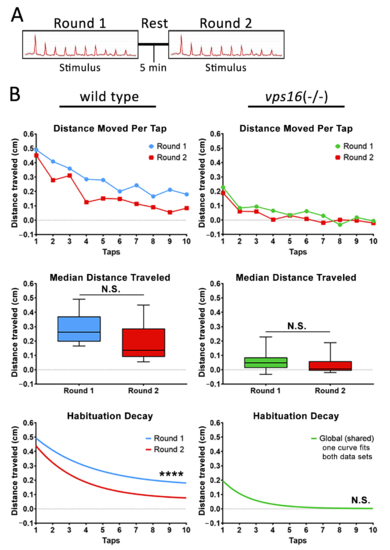
Sibling larvae at 7 dpf do show distinct habituation response post 5 min rest, but vps16(-/-) mutants do not show distinct response. (A) Schematic representation of intermediate memory paradigm showing round one stimulus having 10 high-intensity taps, followed by 5 min rest period with no stimulation, and finally round two stimulus having 10 high-intensity taps. (B) Line graph representing average distance traveled in response to each individual tap by 7 dpf siblings (blue, n = 60) and vps16(-/-) mutants (green, n = 59) larvae before and after 5 min rest period (red). Box plots representing median distance traveled by 7 dpf siblings (blue, n = 60) and vps16(-/-) (green, n = 59) larvae in response to multiple-tap stimuli before and after 5 min rest period (red). First-order exponential decay curve representing average distance traveled in response to round one multiple-tap stimuli by 7 dpf siblings (blue, n = 60) and vps16(-/-) mutant (green, n = 59) larvae before and after 5 min rest period (red). For all graphs, “N.S.” = not significant, “****” = p < 0.0001, and error bars indicate SEM. PHENOTYPE:
|
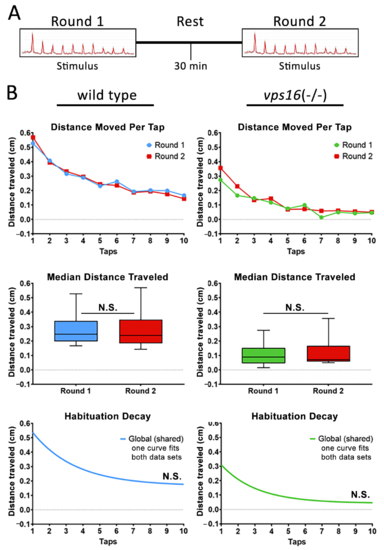
Figure 9 Both sibling larvae and vps16(-/-) mutants at 7 dpf do not show distinct habituation response post 30 min rest. (A) Schematic representation of intermediate memory paradigm showing round one stimulus having 10 high-intensity taps, followed by 30 min rest period with no stimulation, and finally round two stimulus having 10 high-intensity taps. (B) Line graph representing average distance traveled in response to each individual tap by 7 dpf siblings (blue, n = 72) and vps16(-/-) mutants (green, n = 68) before and after 30 min rest period (red). Box plots representing median distance traveled by 7 dpf siblings (blue, n = 72) and vps16(-/-) (green, n = 68) larvae in response to multiple-tap stimuli before and after 30 min rest period (red). First-order exponential decay curve representing average distance traveled in response to round one multiple-tap stimuli by 7 dpf siblings (blue, n = 72) and vps16(-/-) mutant (green, n = 68) larvae before and after 30 min rest period. For all graphs, “N.S.” = not significant, and error bars indicate SEM. PHENOTYPE:
|