
Fig. 4
- ID
- ZDB-IMAGE-240715-64
- Publication
- Banerjee et al., 2024 - Hypomyelinated vps16 Mutant Zebrafish Exhibit Systemic and Neurodevelopmental Pathologies
- All Figures
- Figures for Banerjee et al., 2024
|
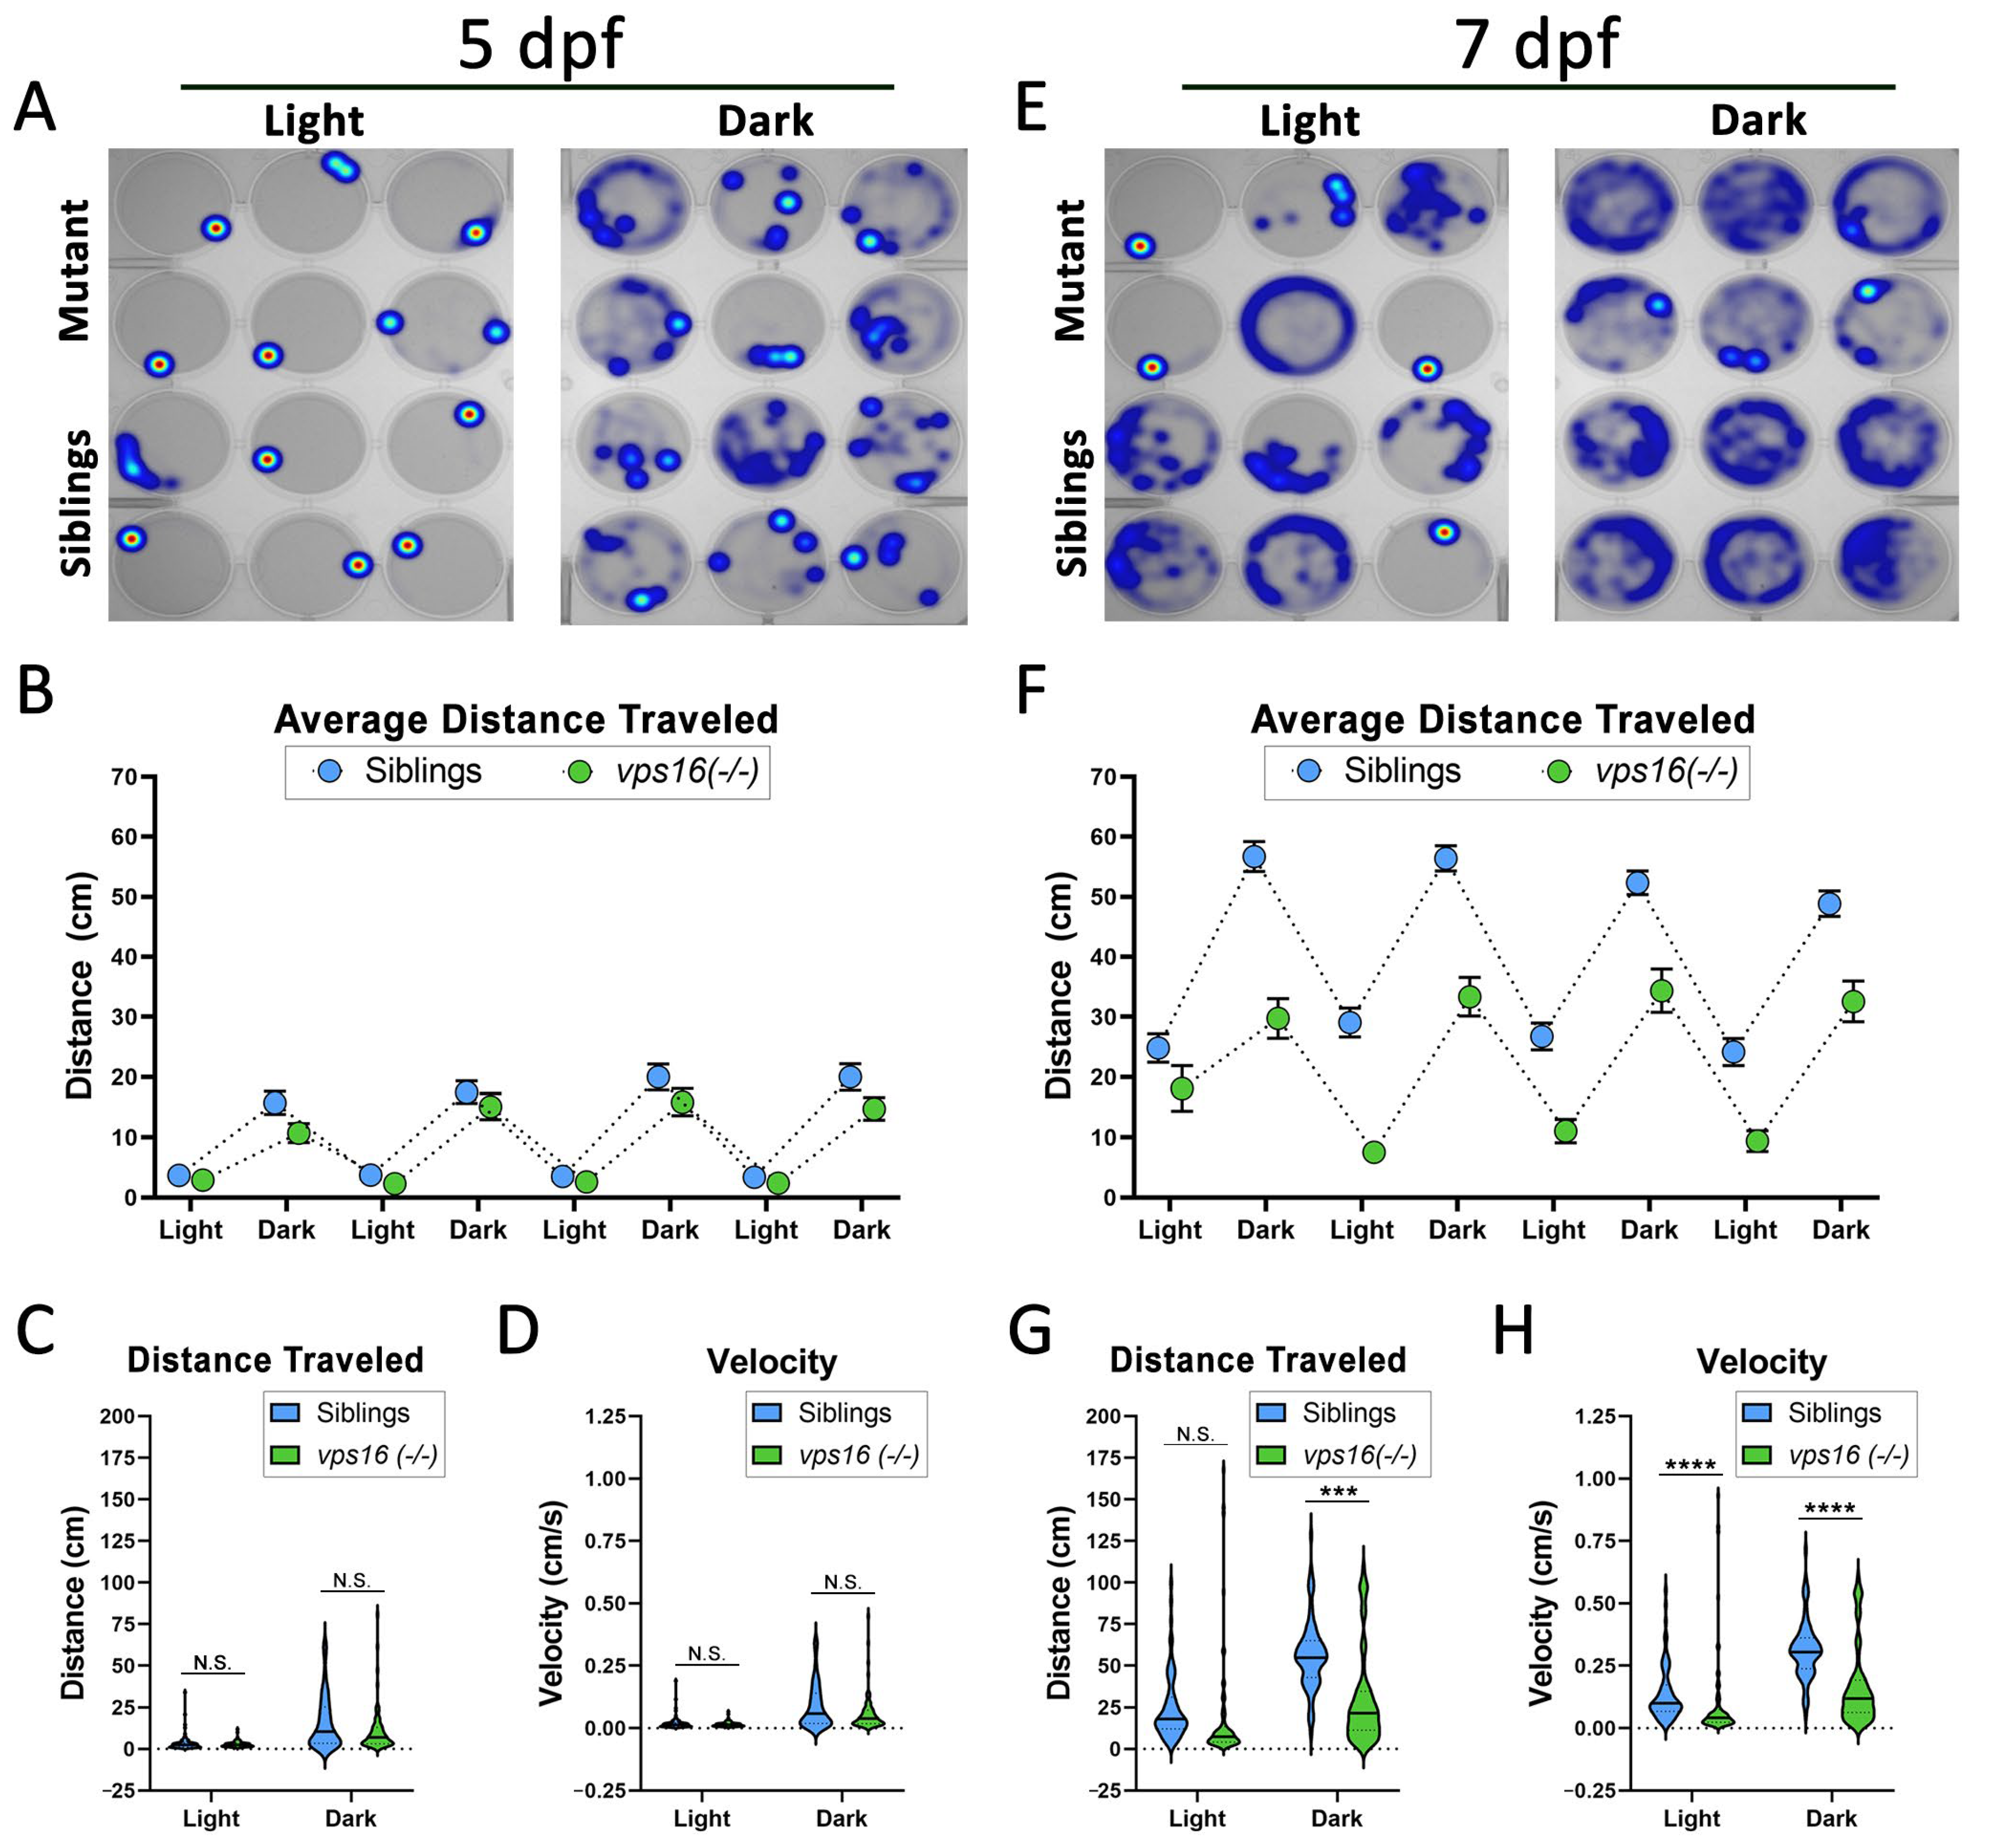
Fig. 4 vps16(-/-) mutants show normal distance traveled at 5 dpf and significantly reduced distance traveled at 7 dpf in response to alternating cycles of light and dark. (A) Representative heatmap images of total distance moved by individual vps16(-/-) larvae at 5 dpf (mutants = top two rows, siblings = bottom two rows) during 3 min period of light and dark. (B) Graph representing average distance traveled by vps16(-/-) larvae at 5 dpf in 4 alternating light/dark cycles of 3 min each (siblings in blue; mutants in green). (C) Graph representing average distance traveled by siblings (blue, n = 71) and vps16(-/-) (green, n = 72) in light and dark periods. (D) Graph representing average velocity of siblings (blue, n = 71) and vps16(-/-) (green, n = 72) in light and dark periods. (E) Representative heatmap images of total distance moved by individual vps16(-/-) larvae at 7 dpf (mutants = top two rows; siblings = bottom two rows) during 3 min period of light and dark. (F) Graph representing average distance traveled by vps16(-/-) larvae at 7 dpf in 4 alternating light/dark cycles of 3 min each (siblings in blue; mutants in green). (G) Graph representing average distance traveled by siblings (blue, n = 72) and vps16(-/-) (green, n = 72) in light and dark periods. (H) Graph representing average velocity of siblings (blue, n = 72) and vps16(-/-) (green, n = 72) in light and dark periods. For all graphs, “N.S.” = not significant, “***” = p < 0.001, “****” = p < 0.0001, and error bars indicate SEM.