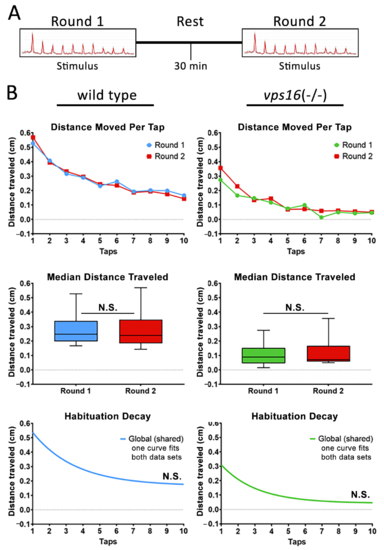
Figure 9 Both sibling larvae and vps16(-/-) mutants at 7 dpf do not show distinct habituation response post 30 min rest. (A) Schematic representation of intermediate memory paradigm showing round one stimulus having 10 high-intensity taps, followed by 30 min rest period with no stimulation, and finally round two stimulus having 10 high-intensity taps. (B) Line graph representing average distance traveled in response to each individual tap by 7 dpf siblings (blue, n = 72) and vps16(-/-) mutants (green, n = 68) before and after 30 min rest period (red). Box plots representing median distance traveled by 7 dpf siblings (blue, n = 72) and vps16(-/-) (green, n = 68) larvae in response to multiple-tap stimuli before and after 30 min rest period (red). First-order exponential decay curve representing average distance traveled in response to round one multiple-tap stimuli by 7 dpf siblings (blue, n = 72) and vps16(-/-) mutant (green, n = 68) larvae before and after 30 min rest period. For all graphs, “N.S.” = not significant, and error bars indicate SEM.
|
