
- Title
-
MOXD1 is a lineage-specific gene and a tumor suppressor in neuroblastoma
- Authors
- Fredlund, E., Andersson, S., Hilgert, E., Monferrer, E., Álvarez-Hernán, G., Karakaya, S., Loontiens, S., Bek, J.W., Gregor, T., Lecomte, E., Magnusson, E., Miltenyte, E., Cabirol, M., Kyknas, M., Engström, N., Henriksson, M.A., Hammarlund, E., Rosenblum, J.S., Noguera, R., Speleman, F., van Nes, J., Mohlin, S.
- Source
- Full text @ Sci Adv
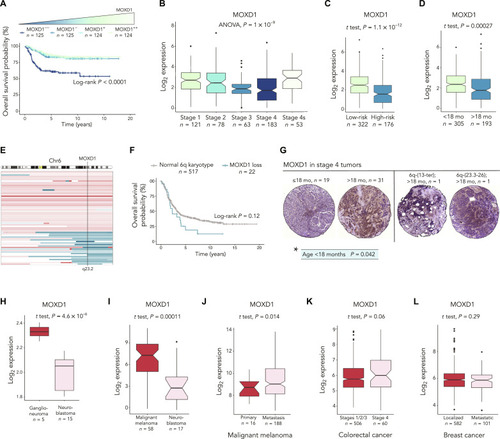
The correlation between low ( |
( |
( |
( |
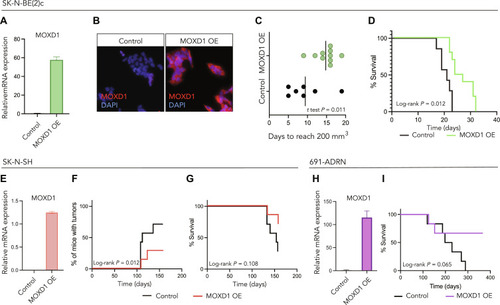
( |
( |
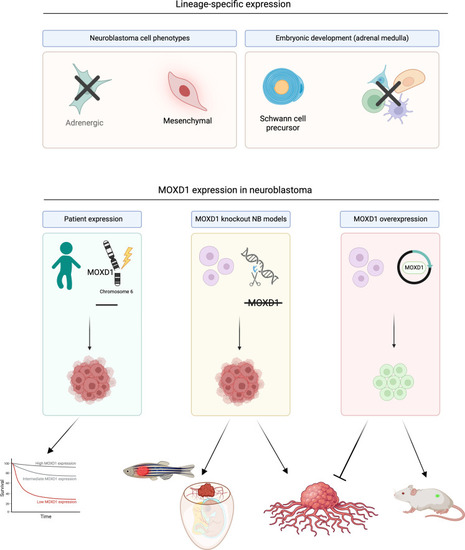
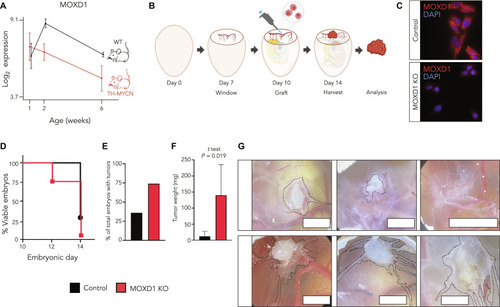
Graphical visualization of MOXD1 in healthy and tumor development. Created with BioRender.com. |