|
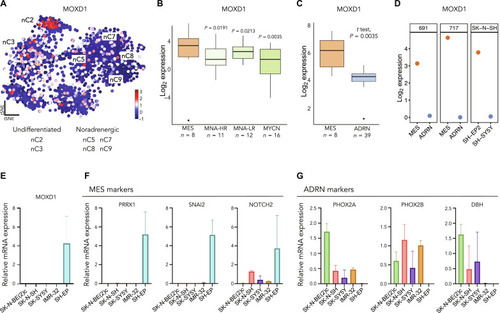
MOXD1 is expressed in MES-like neuroblastoma cells. (A) Mapping of MOXD1 mRNA expression in the t-distributed stochastic neighbor embedding (tSNE) of human neuroblastoma single nuclei data by Bedoya-Reina et al. (17). nCx (2, 3, 5, 7, 8, and 9) are selected clusters from the abovementioned published data. (B) Expression of MOXD1 in the cohort from Gartlgruber et al. (15). The groups include MES (mesenchymal), NMNA-HR/LR (MYCN nonamplified high-risk/low-risk), and MYCN (MYCN amplified). Number of patients (n) is depicted in the graph, and P values were generated by analysis of variance (ANOVA), followed by Fisher’s least significant difference (LSD) test. (C) The MOXD1 mRNA expression in neuroblastoma cells with ADRN and MES gene signatures. The number of samples (n) for each cell phenotype is depicted in the graph, and P value by t test as indicated. (D) RNA-seq–derived expression of MOXD1 in the isogenic neuroblastoma cell line pairs. (E) MOXD1 mRNA expression in three neuroblastoma cell lines with an ADRN phenotype (SK-N-BE(2)c, SH-SY5Y, and IMR-32), one with a mixed phenotype (SK-N-SH), and one with the MES phenotype (SH-EP) as assessed by qPCR. Error bars denote SD from n = 2 to 3 biologically independent repeats per cell line. (F and G) Expression of MES- (F) and ADRN- (G) associated genes as assessed by qPCR. n = 3 biologically independent repeats.
|