
Fig. 2.
- ID
- ZDB-IMAGE-240624-17
- Publication
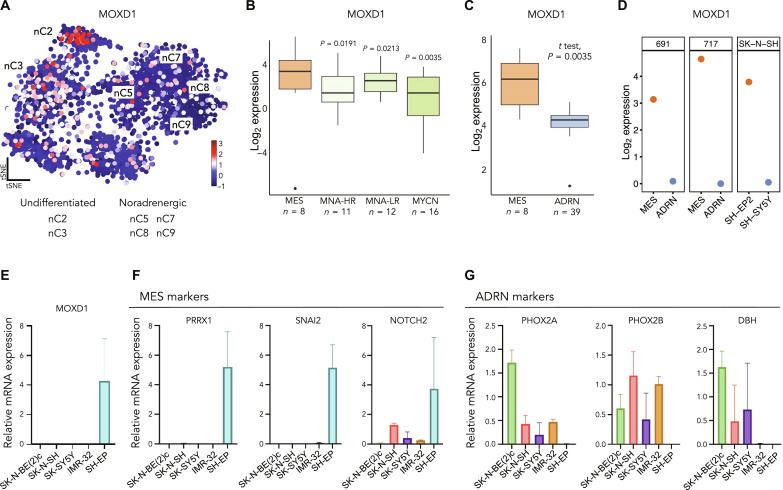
- Fredlund et al., 2024 - MOXD1 is a lineage-specific gene and a tumor suppressor in neuroblastoma
- All Figures
- Figures for Fredlund et al., 2024
|
Fig. 2.
(