
- Title
-
Aluminum chloride and D-galactose induced a zebrafish model of Alzheimer's disease with cognitive deficits and aging
- Authors
- Luo, L., Yan, T., Yang, L., Zhao, M.
- Source
- Full text @ Comput Struct Biotechnol J
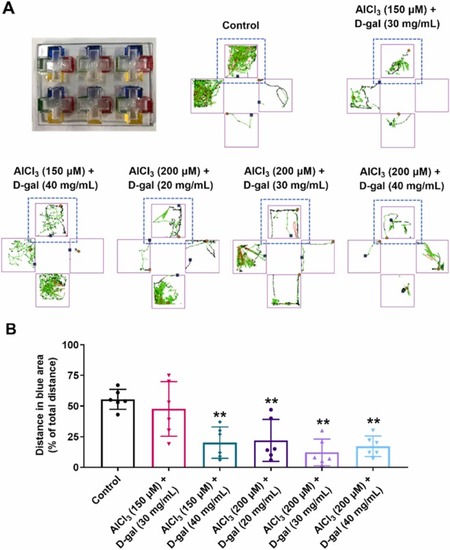
Assessment of color-associated learning and memory in the plus-maze test. A: Schematic diagram of plus-maze and representative swimming trajectories in the plus-maze test. B: Quantitative analysis of the ratio of distance swam in the blue area to the total distance swam in 2 dpf zebrafish after exposure to four different combinations of AlCl3 and D-gal for 72 h. Data are presented as the mean ± SEM (n = 30 zebrafish larvae per group), and the distance of five zebrafish represents one data point. Statistical significance of treatment effects was assessed using one-way ANOVA with Dunnett’s multiple comparison test and illustrated as follows: * * p < 0.01 (versus the control group). PHENOTYPE:
|
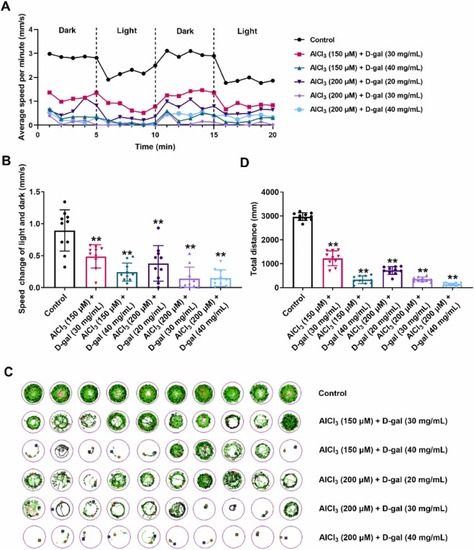
Assessment of the response ability and locomotor behavior in the light-dark test. A: Locomotor patterns and average speed during dark-light stimulations of zebrafish after exposure to four different combinations of AlCl3 and D-gal from 2 to 5 dpf. B: Quantitative analysis of the average speed change during light-dark stimulations. C: Representative traces of total locomotor activity in different groups during all light-dark stimulations. D: Quantitative analysis of total distance swam during all light-dark stimulations. In B and D, data are presented as the mean ± SEM (n = 10 zebrafish larvae per group). Statistical significance of treatment effects was assessed using one-way ANOVA with Dunnett’s multiple comparison test and illustrated as follows: * * p < 0.01 (versus the control group). PHENOTYPE:
|
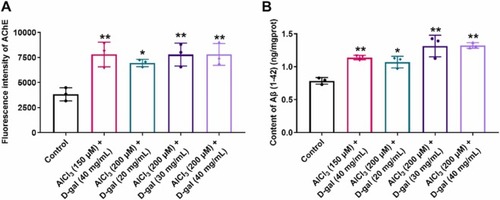
Determination of AChE activity and Aβ1–42 content. A, B: Quantitative analysis of AChE fluorescence intensity (A) and Aβ1–42 plaques (B) after exposure of 2 dpf zebrafish to four combinations of AlCl3 and D-gal for 72 h. Data are presented as the mean ± SEM (n = 3). Statistical significance of treatment effects was assessed using one-way ANOVA with Dunnett’s multiple comparison test and illustrated as follows: * p < 0.05, * * p < 0.01 (versus control group). PHENOTYPE:
|
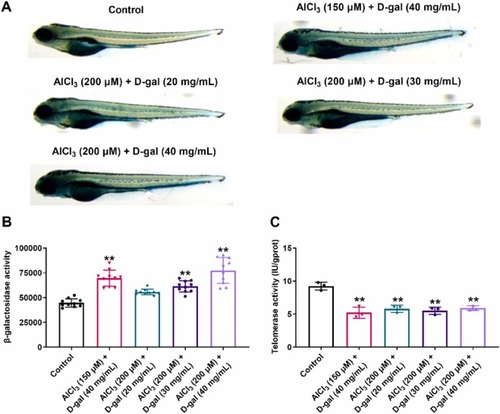
Determination of β-galactosidase and telomerase levels. A: Representative images of staining for β-galactosidase. B, C: Quantitative analysis of β-galactosidase (B) and telomerase (C) activities after exposure of 2 dpf zebrafish to four different combinations of AlCl3 and D-gal for 72 h. Data are presented as the mean ± SEM (n = 10 in B and n = 3 in C). In B and C, statistical significance of treatment effects was assessed using one-way ANOVA with Dunnett’s multiple comparison test and illustrated as follows: * * p < 0.01 (versus control group). PHENOTYPE:
|
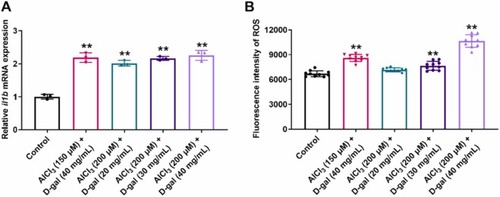
Determination of il1b expression and ROS levels. A: Quantitative analysis of the relative il1b mRNA expression normalized by actb1 mRNA level in 2 dpf zebrafish exposed to four combinations of AlCl3 and D-gal for 72 h. B: Quantitative analysis of the fluorescence intensity of ROS levels after exposure of 2 dpf zebrafish to four different combinations of AlCl3 and D-gal for 72 h. Data are presented as the mean ± SEM (n = 3 in A and n = 10 in B). Statistical significance of treatment effects was assessed using one-way ANOVA with Dunnett’s multiple comparison test. |