
Image
|
Figure Caption
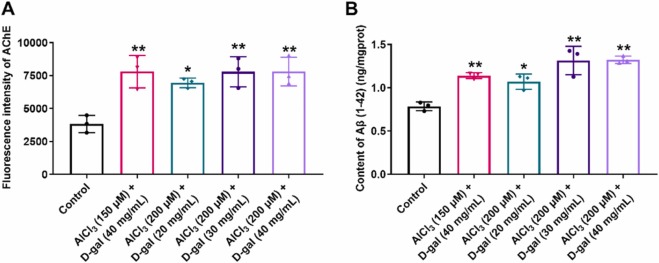
Fig. 3 Determination of AChE activity and Aβ1–42 content. A, B: Quantitative analysis of AChE fluorescence intensity (A) and Aβ1–42 plaques (B) after exposure of 2 dpf zebrafish to four combinations of AlCl3 and D-gal for 72 h. Data are presented as the mean ± SEM (n = 3). Statistical significance of treatment effects was assessed using one-way ANOVA with Dunnett’s multiple comparison test and illustrated as follows: * p < 0.05, * * p < 0.01 (versus control group).
Figure Data
Acknowledgments
This image is the copyrighted work of the attributed author or publisher, and
ZFIN has permission only to display this image to its users.
Additional permissions should be obtained from the applicable author or publisher of the image.
Full text @ Comput Struct Biotechnol J