
- Title
-
Molecular variations to the proteome of zebrafish larvae induced by environmentally relevant copper concentrations
- Authors
- Green, S.L., Silvester, E., Dworkin, S., Shakya, M., Klein, A., Lowe, R., Datta, K., Holland, A.
- Source
- Full text @ Aquat. Toxicol.

Dose-response curve of surviving larvae after exposing to a range of copper (Cu) concentrations. Zebrafish larvae at 120-h post fertilisation (hpf) after exposure to copper (Cu) for 96 h that did not display the endpoints of loss of equilibrium (LOE) and non-hatching were represented through survival. Cu concentrations are log-transformed. Shaded areas represent 95 % confidence intervals. Each point represents the percentage of healthy embryos in a replicate petri dish (n = 3) at its corresponding measured Cu concentration. |

Amino acid (AA) composition in zebrafish larvae. The influence of Cu on individual AA proportions (% mol) in zebrafish after 96 h (n = 5) exposed to: no Cu (Control: red), 4.9 μg Cu L−1 (EC10: green) or 10.7 μg Cu L−1 (EC50: blue). Asterisks are used to indicate significant differences between treatments for each AA. |

Protein identification and differentially expressed proteins (DEPs) in copper (Cu) exposed zebrafish larvae after 48 and 96 h. Shown are: (a) The total number of proteins identified in each sample from the zebrafish genome, (b) the number of DEPs between treatments and controls, and (c) volcano plots visualising the upregulated and downregulated DEPs at 48 and 96 h. Differentially expressed proteins are characterised by a log2 fold change of >1 or <−1 and significance is determined by an adjusted p-value (alpha) of <0.1 |

Functional enrichment analysis of differentially expressed proteins (DEP). Gene ontology (GO) enrichment analysis and Kyoto Encyclopedia of Genes and Genomes (KEGG) pathway annotation of zebrafish larvae exposed to copper (Cu) for 48 h (n = 3). The GO encompassing the: (a) biological processes; (b) molecular function; (c) cellular component categories and (d) KEGG pathways, are shown. The top 10 categories of each, based on the highest number of counts (number of proteins in category) followed by Enrichment Threshold (EASE), set to <0.5, are shown. |
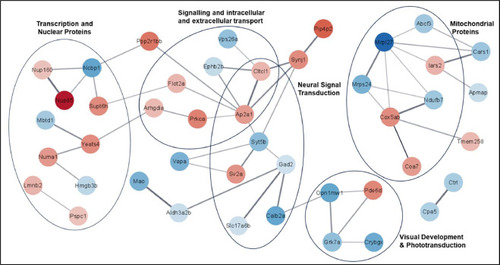
Function enrichment analysis visualised in a protein-protein interaction (PPI) network of significant differentially expressed proteins (DEPs) in copper (Cu) – stressed zebrafish. Larvae were exposed to 10.7 μg L−1 of Cu (EC50) for 48 h and DEPs were sorted by STRING and visualised using Cytoscape (average clustering coefficient 0.261). The network contains 66 nodes and 52 edges, and proteins with no interactions within the network (singletons) were omitted. Nodes are coloured by their log fold change with red filled nodes being upregulated and blue filled nodes being downregulated proteins, with intensity correlating to a greater fold change. Edges indicate protein-protein interactions determined by STRING and intensity is relational to its confidence score. |