
Image
|
Figure Caption
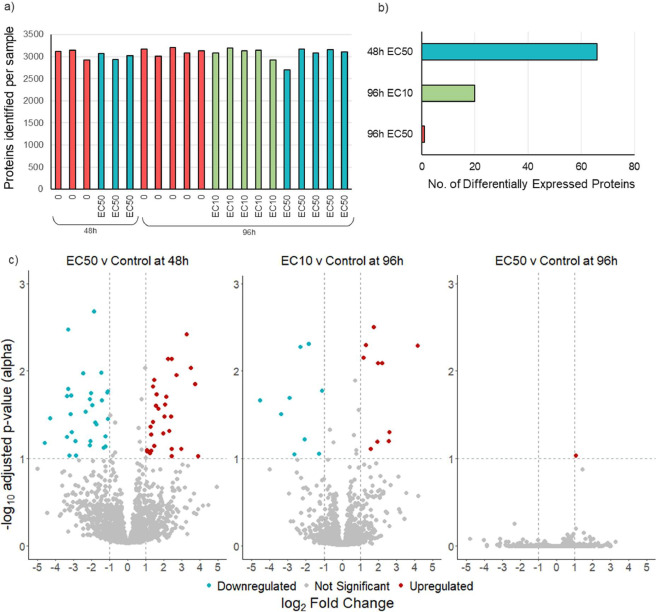
Fig. 3 Protein identification and differentially expressed proteins (DEPs) in copper (Cu) exposed zebrafish larvae after 48 and 96 h. Shown are: (a) The total number of proteins identified in each sample from the zebrafish genome, (b) the number of DEPs between treatments and controls, and (c) volcano plots visualising the upregulated and downregulated DEPs at 48 and 96 h. Differentially expressed proteins are characterised by a log2 fold change of >1 or <−1 and significance is determined by an adjusted p-value (alpha) of <0.1
Acknowledgments
This image is the copyrighted work of the attributed author or publisher, and
ZFIN has permission only to display this image to its users.
Additional permissions should be obtained from the applicable author or publisher of the image.
Full text @ Aquat. Toxicol.