
Image
|
Figure Caption
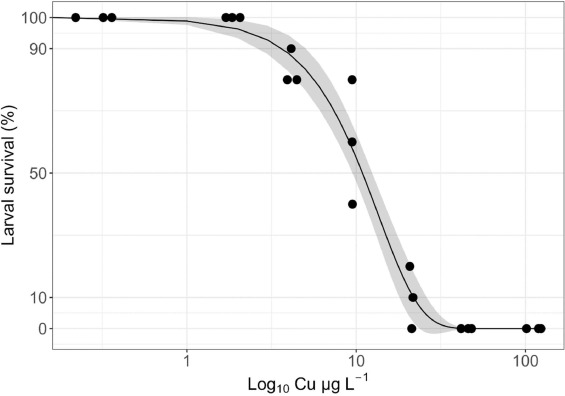
Fig. 1 Dose-response curve of surviving larvae after exposing to a range of copper (Cu) concentrations. Zebrafish larvae at 120-h post fertilisation (hpf) after exposure to copper (Cu) for 96 h that did not display the endpoints of loss of equilibrium (LOE) and non-hatching were represented through survival. Cu concentrations are log-transformed. Shaded areas represent 95 % confidence intervals. Each point represents the percentage of healthy embryos in a replicate petri dish (n = 3) at its corresponding measured Cu concentration.
Acknowledgments
This image is the copyrighted work of the attributed author or publisher, and
ZFIN has permission only to display this image to its users.
Additional permissions should be obtained from the applicable author or publisher of the image.
Full text @ Aquat. Toxicol.