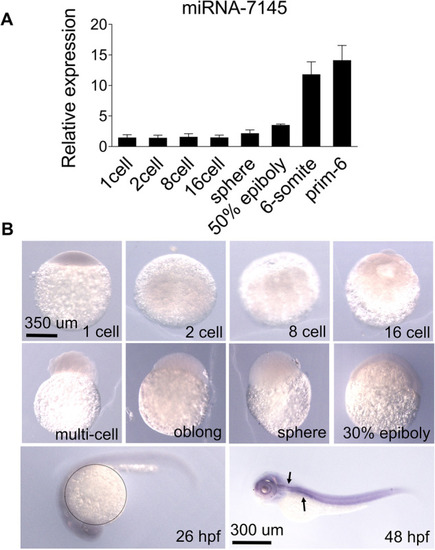
Spatial-temporal expression pattern of miRNA-7145 in wild-type embryos.

A Quantitative RT-PCR showing miRNA-7145 expression during embryogenesis. The data were calculated with two biological repetitions. Error bars represent SEM. B Whole mount in situ RNA hybridization showing the miRNA-7145 expression pattern in wild-type embryos. The arrows indicate the expression site of miRNA-7145. Circle, yolk sac. Scale bar, 1–30% epiboly 350 μm, 26 hpf-48 hpf, 300 μm.

Effect of miRNA-7145 overexpression on hematopoiesis.

The embryos were injected with 200 pg miRNA-7145 mimics at the 1 cell stage, and the embryos were collected at 26 hpf. AE Detection of myeloid cell marker expression at 26 hpf with whole mount in situ hybridization. Alyz expression, Cmfap4 expression, EPU.1 expression. B Statistics of lyz positive cells and D Statistics of mfap4 positive cells. Fgata1a expression, GRunx1 expression at 26 hpf. H qRT-PCR showing relative RNA expression in control and in embryos injected with miRNA mimics. Relative expression is normalized to β-actin. Data are presented as mean ± SEM. Scale bar is shown in the Figure. *P < 0.05, **P < 0.01, ***P < 0.001.

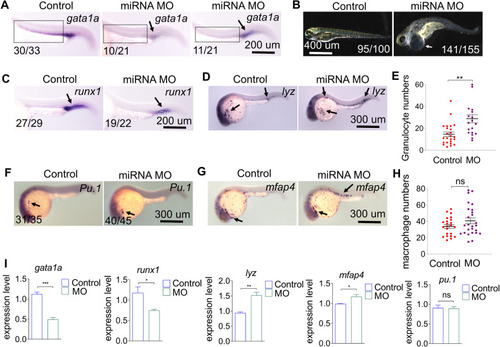
Effect of miRNA-7145 knock-down on hematopoiesis.

Embryos were injected with 10 ng miRNA-7145 MO at the 1 cell stage, and the embryos were collected at 26 hpf and 4 dpf. Agata1a expression, B the cardiac edema phenotype occurs 4 dpf after miRNA MO injection, CRunx1 expression. DH Detection of myeloid cell marker expression at 26 hpf with whole mount in situ hybridization. Dlyz expression, FPu.1 expression, Gmfap4 expression. E Statistics of lyz-positive cells and H statistics of mfap4 positive cells. I qRT-PCR showing relative RNA expression in control and embryos injected miRNA MO. Relative expression is normalized to β-actin. Data are presented as mean ± SEM. Scale bar is shown in the Figure. *P < 0.05, **P < 0.01, ***P < 0.001.

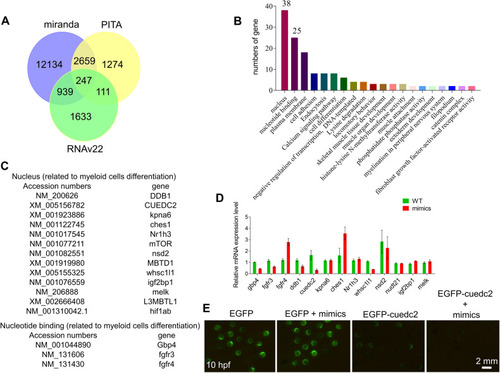
A target gene of miRNA-7145 was identified by bioinformatics analysis and fluorescence reporting experiments.

A Venn diagram of predicted miRNA-7145 targeted-genes using three different methods. B KEGG enrichment analysis of common targeted-genes predicted by the three different methods. C List of targeted-genes located in the nucleus and associated with myeloid cells. D qRT-PCR showing RNA expression in control embryos injected with miRNA-7145 mimics. The embryos were injected with 200 pg miRNA-7145 mimics at the 1 cell stage, and the embryos were collected at 26 hpf. Relative expression is normalized to β-actin. Data are presented as mean ± SEM. E Expression of EGFP and cuedc2 fusion. All components were injected with 200 pg RNA at the 1 cell stage. Scale bar, 2 mm. *P < 0.05, **P < 0.01, ***P < 0.001.

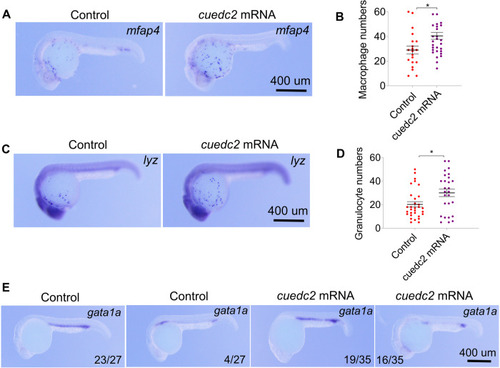
Effect of cuedc2 overexpression on hematopoiesis.

Embryos were injected with 200 pg cuedc2 mRNA at the 1 cell stage, and the embryos were collected at 26 hpf. AD Detection of myeloid cell marker expression at 26 hpf with whole mount in situ hybridization. Amfap4 expression, Clyz expression. B Statistics of mfap4 positive cells and D statistics of lyz positive cells. Egata1a expression. Scale bar, 400 μm. *P < 0.05, **P < 0.01, ***P < 0.001.

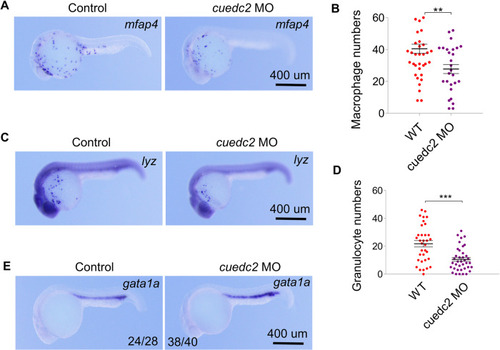
Effect of cuedc2 knock-down on hematopoiesis.

The embryos were injected with 10 ng cuedc2 MO at the 1 cell stage, and the embryos were collected at 26 hpf. AD Detection of myeloid cell marker expression at 26 hpf with whole mount in situ hybridization. Amfap4 expression, Clyz expression. B Statistics of mfap4 positive cells and D statistics of lyz positive cells. Egata1a expression. Scale bar, 400 μm. *P < 0.05, **P < 0.01, ***P < 0.001.

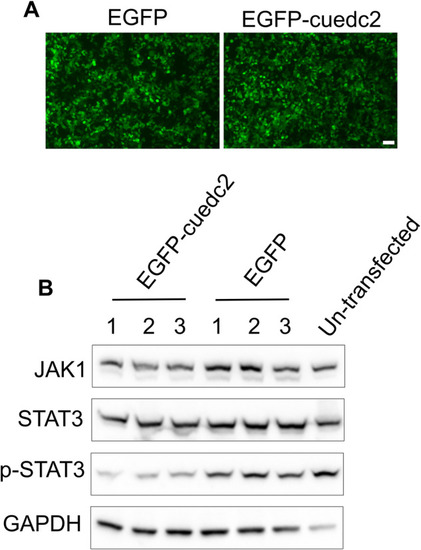
Effect of zebrafish cuedc2 overexpression on the JAK1/STAT3 signaling pathway.

A 293 T cells were transfected with EGFP plasmid or EGFP-cuedc2 plasmid, and green fluorescence was captured with a fluorescence microscope. B 293 T cells were collected to performed western blot. Numbers indicate biological replicates. Scale bar, 150 μm.

Acknowledgments
This image is the copyrighted work of the attributed author or publisher, and ZFIN has permission only to display this image to its users. Additional permissions should be obtained from the applicable author or publisher of the image. Full text @ Cell Death Discov