
- Title
-
Differential Roles of Diet on Development and Spinal Cord Regeneration in Larval Zebrafish
- Authors
- Purifoy, E.J., Mruk, K.
- Source
- Full text @ Zebrafish
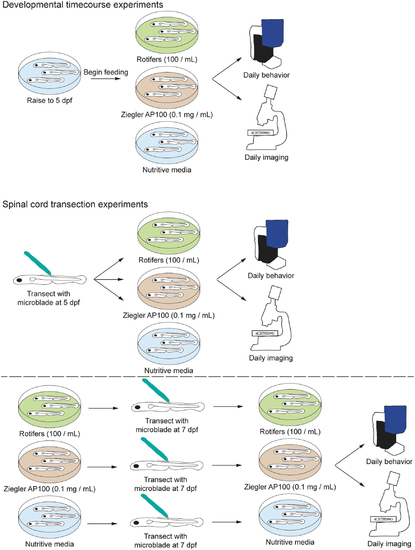
Schematic of experimental design. For developmental studies, larvae were raised until 5 dpf, and then given one of three diets. Larvae were recorded daily for length and swim behavior. For transection experiments, larvae were either transected at 5 dpf and recovered in different diets or were fed one diet from 5 to 6 dpf, were transected at 7 dpf, and resumed their assigned diet at 8 dpf. All larvae were recorded daily for length, glial bridge formation, and swim behavior. dpf, days postfertilization. |
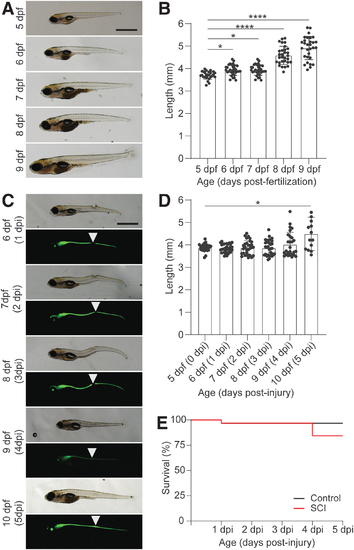
Rotifer-fed larvae have continued growth and regeneration after SCI. (A) Representative bright field micrographs of zebrafish larvae from 5 dpf through 9 dpf are shown (n = 30). (B) Quantification of larval zebrafish length. Larvae were measured in Fiji and the average length of the larvae ± SD plotted. Values for individual fish are shown. The nonparametric Kruskal–Wallis test was used to determine significance. (C) Representative bright field and fluorescent micrographs from Tg(gfap:EGFP) larvae are shown after SCI (n = 27). Arrowhead denotes location of injury. (D) Length of larvae was quantified as in (B). (E) Graphs are Kaplan–Meier curves for control (black) and SCI (red). The survival curves for larvae transected at 5 dpf did not significantly differ from control larvae (χ2 = 2.641, p = 0.1041). For all micrographs, larvae orientation is lateral view, anterior left. Scale bar: 1 mm. *p ≤ 0.05, ****p ≤ 0.0001. SCI, spinal cord injury. |
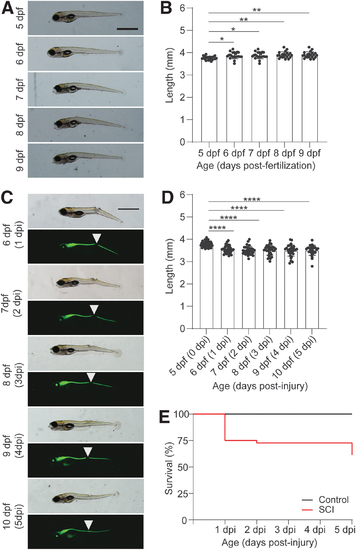
Larvae fed with Zeigler AP100 diet only show continued growth without an SCI. (A) Representative bright field micrographs of zebrafish larvae from 5 dpf through 9 dpf are shown (n = 21). (B) Quantification of larval zebrafish length. Larvae were measured in Fiji and the average length of the larvae ± SD plotted. Values for individual fish are shown. The nonparametric Kruskal–Wallis test was used to determine significance. (C) Representative bright field and fluorescent micrographs from Tg(gfap:EGFP) larvae are shown after SCI (n = 27). Arrowhead denotes location of injury. (D) Length of larvae was quantified as in (B). (E) Graphs are Kaplan–Meier curves for control (black) and SCI (red). The survival curves for larvae transected at 5 dpf significantly differed from control larvae (χ2 = 10.41, p = 0.0013). For all micrographs, larvae orientation is lateral view, anterior left. Scale bar: 1 mm. *p ≤ 0.05, **p ≤ 0.01, ****p ≤ 0.0001. |
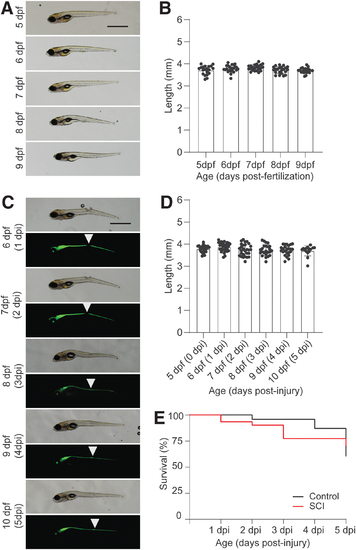
Larvae given nutritive media do not exhibit continued growth. (A) Representative bright field micrographs of zebrafish larvae from 5 dpf through 9 dpf are shown (n = 17). (B) Quantification of larval zebrafish length. Larvae were measured in Fiji and the average length of the larvae ± SD plotted. Values for individual fish are shown. (C) Representative bright field and fluorescent micrographs from Tg(gfap:EGFP) larvae are shown after SCI (n = 22). Arrowhead denotes location of injury. (D) Length of larvae was quantified as in (B). (E) Graphs are Kaplan–Meier curves for control (black) and SCI (red). The survival curves for larvae transected at 5 dpf did not significantly differ from control larvae (χ2 = 0.0025, p = 0.9601). For all micrographs, larvae orientation is lateral view, anterior left. |
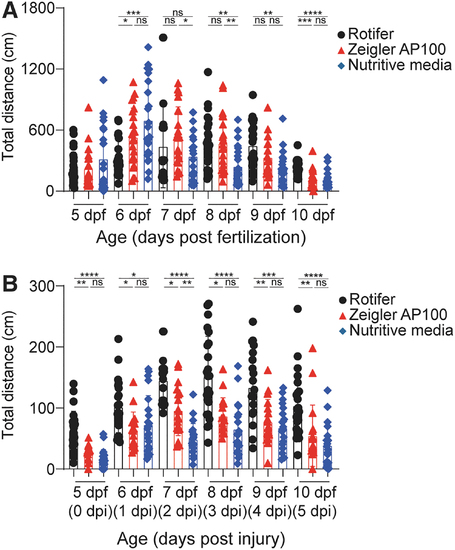
Larvae show differences in total swim distance based on diet. (A) WT larvae were followed from 5 dpf through 9 dpf and free swim followed individually (n = 24 animals/group). Average swim distances ± SD are shown with individual larvae plotted. The nonparametric Kruskal–Wallis test was used to determine significance. (B) Tg(gfap:EGFP) larvae were transected at 5 dpf and free swim followed individually (n = 24 animals/group). Average swim distances ± SD are shown with individual larvae plotted. The nonparametric Kruskal–Wallis test was used to determine significance. Multiple comparisons for each day were compared using a Dunn's post hoc test. For both panels, *p ≤ 0.05, **p ≤ 0.01, ***p ≤ 0.001, ****p ≤ 0.0001. ns, not statistically significant. |