
Fig. 5
- ID
- ZDB-FIG-240524-44
- Publication
- Purifoy et al., 2024 - Differential Roles of Diet on Development and Spinal Cord Regeneration in Larval Zebrafish
- Other Figures
- All Figure Page
- Back to All Figure Page
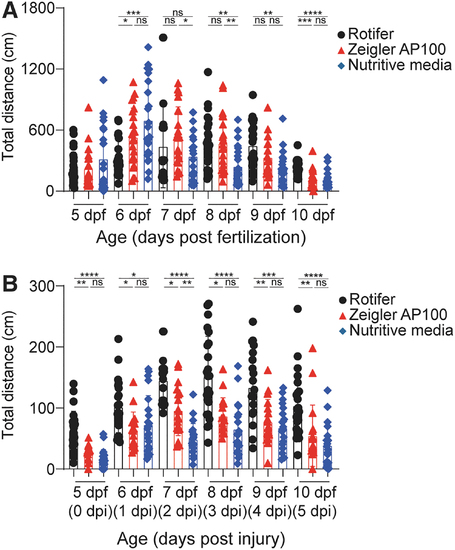
Larvae show differences in total swim distance based on diet. (A) WT larvae were followed from 5 dpf through 9 dpf and free swim followed individually (n = 24 animals/group). Average swim distances ± SD are shown with individual larvae plotted. The nonparametric Kruskal–Wallis test was used to determine significance. (B) Tg(gfap:EGFP) larvae were transected at 5 dpf and free swim followed individually (n = 24 animals/group). Average swim distances ± SD are shown with individual larvae plotted. The nonparametric Kruskal–Wallis test was used to determine significance. Multiple comparisons for each day were compared using a Dunn's post hoc test. For both panels, *p ≤ 0.05, **p ≤ 0.01, ***p ≤ 0.001, ****p ≤ 0.0001. ns, not statistically significant. |