
Fig. 4
- ID
- ZDB-FIG-240524-43
- Publication
- Purifoy et al., 2024 - Differential Roles of Diet on Development and Spinal Cord Regeneration in Larval Zebrafish
- Other Figures
- All Figure Page
- Back to All Figure Page
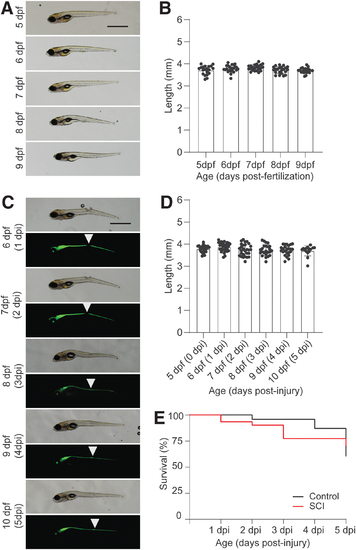
Larvae given nutritive media do not exhibit continued growth. (A) Representative bright field micrographs of zebrafish larvae from 5 dpf through 9 dpf are shown (n = 17). (B) Quantification of larval zebrafish length. Larvae were measured in Fiji and the average length of the larvae ± SD plotted. Values for individual fish are shown. (C) Representative bright field and fluorescent micrographs from Tg(gfap:EGFP) larvae are shown after SCI (n = 22). Arrowhead denotes location of injury. (D) Length of larvae was quantified as in (B). (E) Graphs are Kaplan–Meier curves for control (black) and SCI (red). The survival curves for larvae transected at 5 dpf did not significantly differ from control larvae (χ2 = 0.0025, p = 0.9601). For all micrographs, larvae orientation is lateral view, anterior left. |