
|
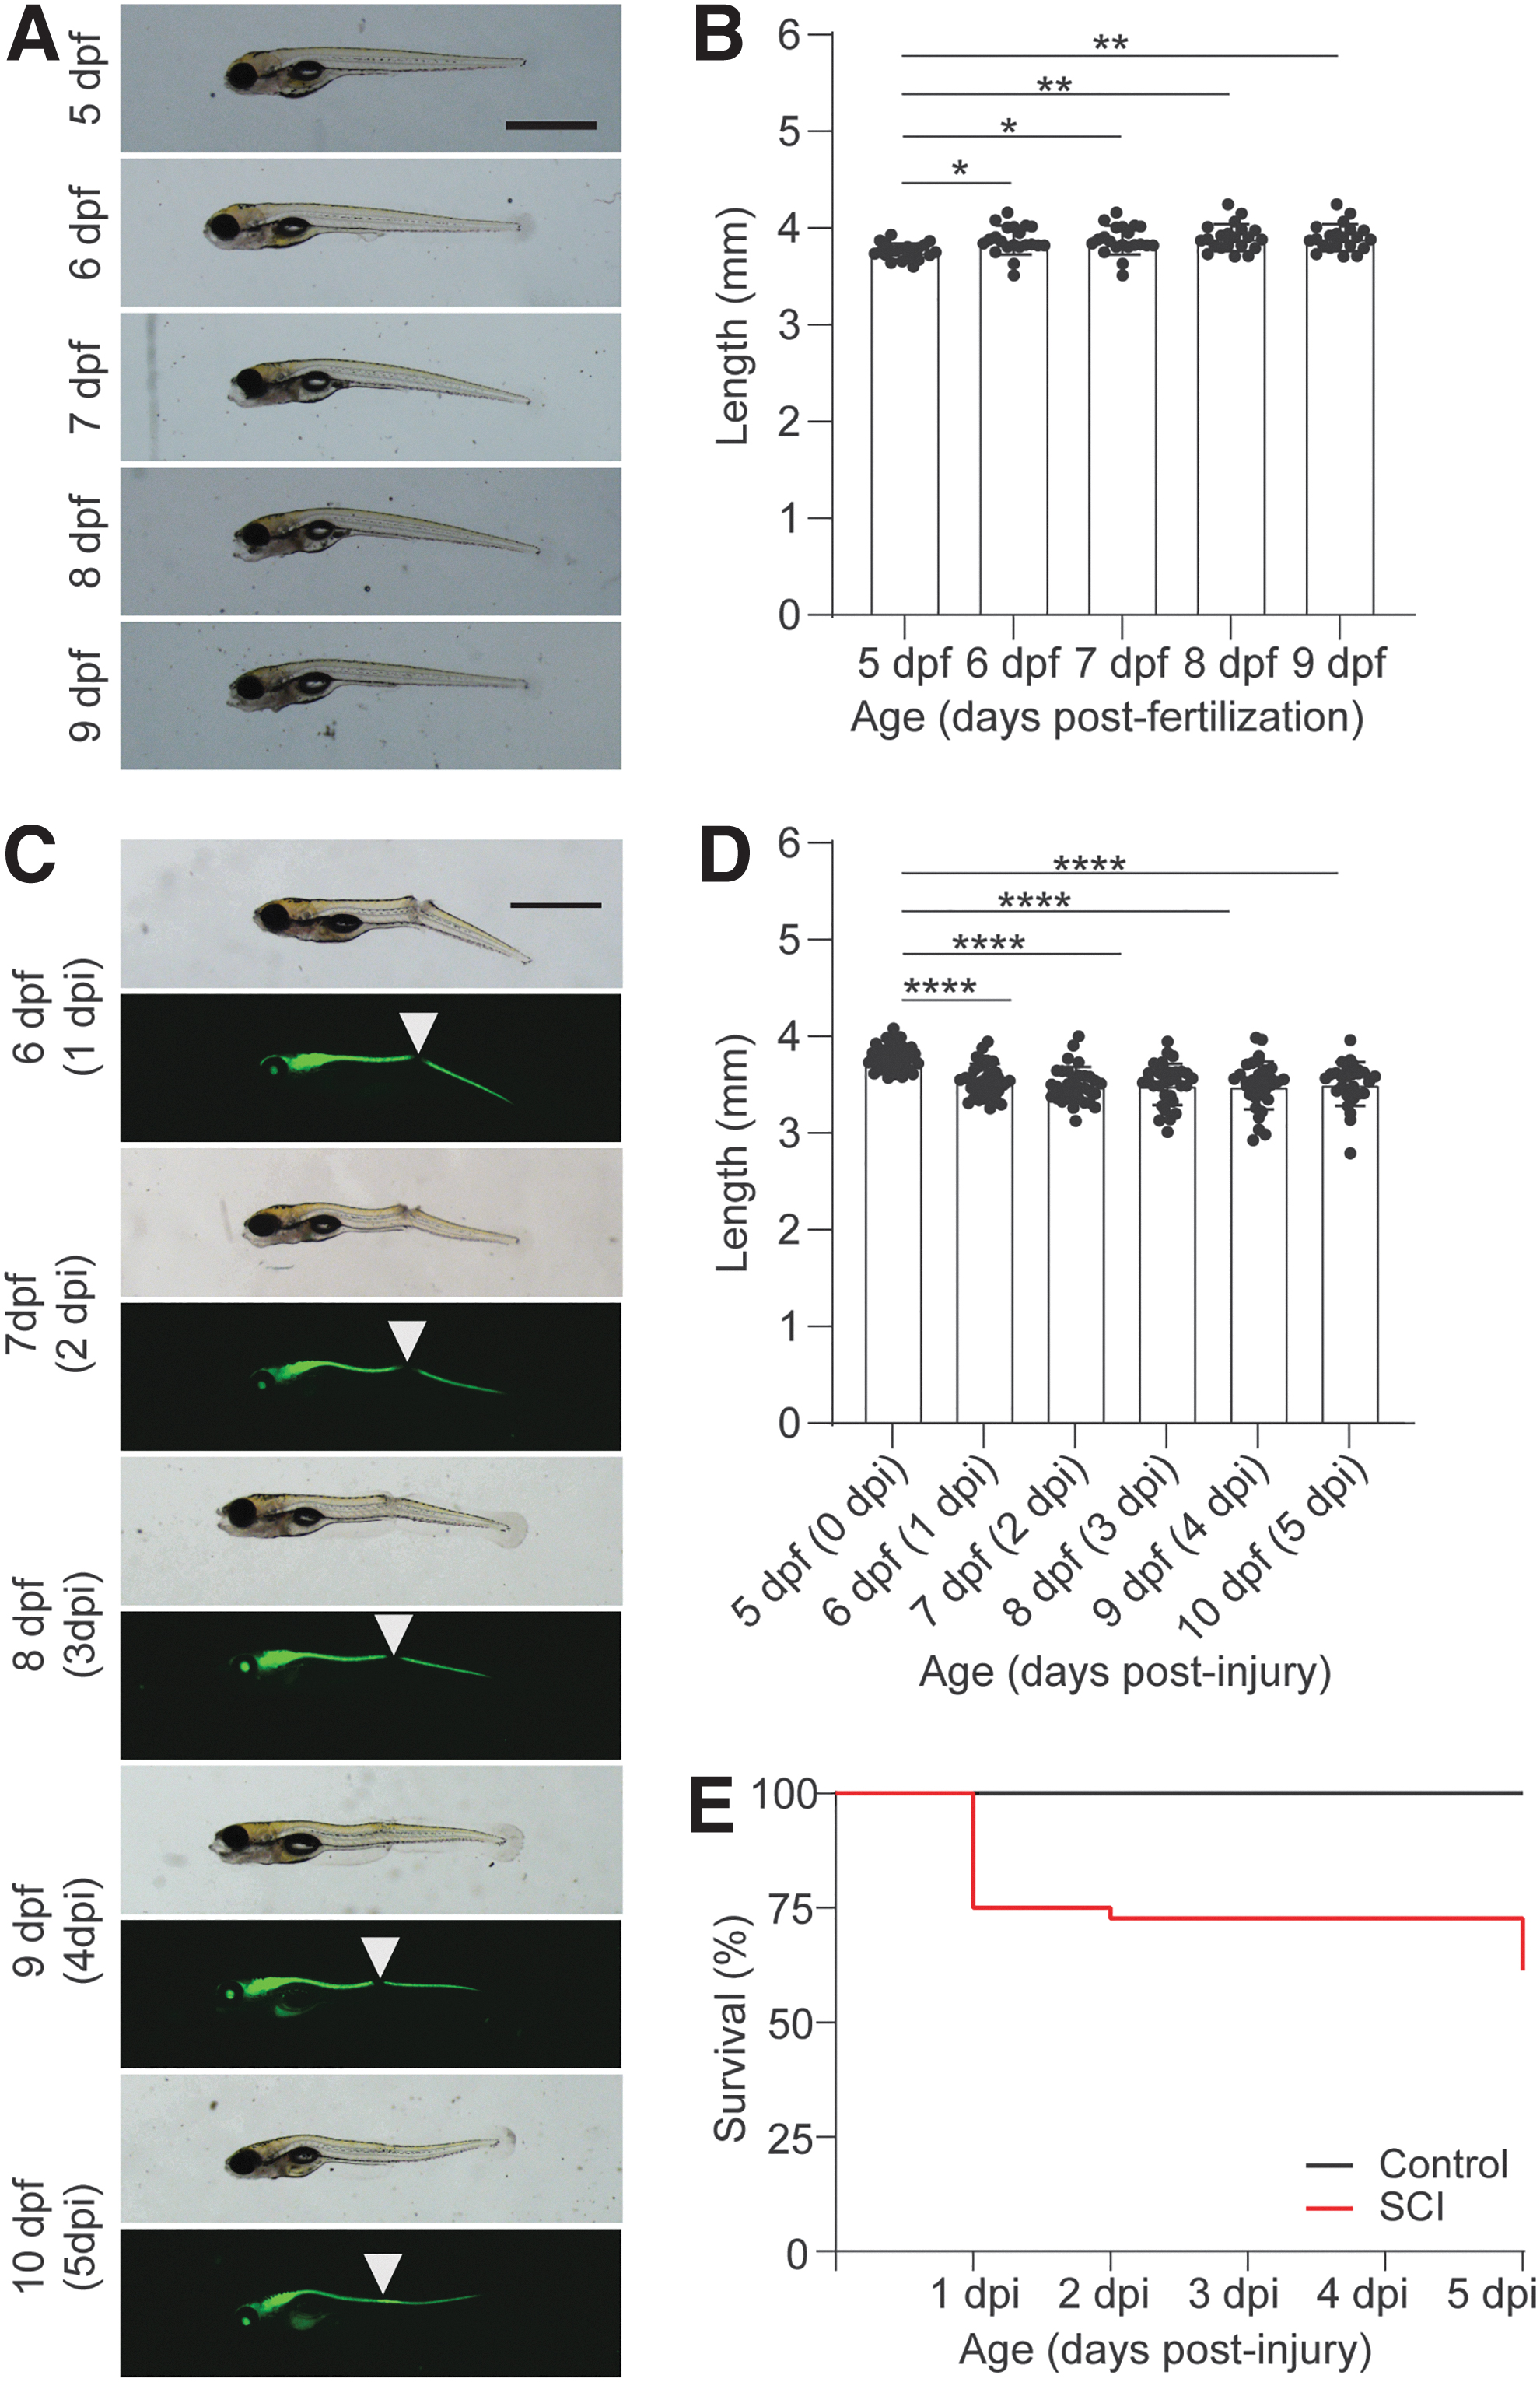
Fig. 3 Larvae fed with Zeigler AP100 diet only show continued growth without an SCI. (A) Representative bright field micrographs of zebrafish larvae from 5 dpf through 9 dpf are shown (n = 21). (B) Quantification of larval zebrafish length. Larvae were measured in Fiji and the average length of the larvae ± SD plotted. Values for individual fish are shown. The nonparametric Kruskal–Wallis test was used to determine significance. (C) Representative bright field and fluorescent micrographs from Tg(gfap:EGFP) larvae are shown after SCI (n = 27). Arrowhead denotes location of injury. (D) Length of larvae was quantified as in (B). (E) Graphs are Kaplan–Meier curves for control (black) and SCI (red). The survival curves for larvae transected at 5 dpf significantly differed from control larvae (χ2 = 10.41, p = 0.0013). For all micrographs, larvae orientation is lateral view, anterior left. Scale bar: 1 mm. *p ≤ 0.05, **p ≤ 0.01, ****p ≤ 0.0001.