FIGURE SUMMARY
Title

Hepatic extracellular ATP/adenosine dynamics in zebrafish models of alcoholic and metabolic steatotic liver disease

Authors
Tokumaru, T., Apolinario, M.E.C., Shimizu, N., Umeda, R., Honda, K., Shikano, K., Teranishi, H., Hikida, T., Hanada, T., Ohta, K., Li, Y., Murakami, K., Hanada, R.
Source
Full text @ Sci. Rep.

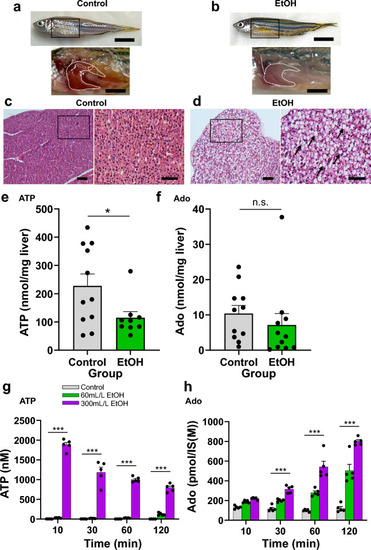
ATP and adenosine (Ado) content in the whole liver of adult zebrafish and HepG2 culture supernatant after ethanol (EtOH) exposure. (a,b) Gross appearance of zebrafish and liver (white dotted line) without (a) or with (b) 0.1% EtOH exposure for 4 weeks. Scale bars 5 mm (top panel) and 2 mm (bottom panel). (c,d) Representative hematoxylin and eosin (HE) staining of the liver sections from adult zebrafish without (c) or with (d) 0.1% EtOH exposure. Lipid droplets in the EtOH group are indicated with black arrows. Scale bar 50 µm (lower magnification) and 40 μm (higher magnification). (e,f) ATP (e) and Ado (f) content in the whole liver tissue of adult zebrafish without or with 0.1% EtOH exposure (n = 10, each group). (g,h) ATP (g) and Ado (h) content in HepG2 culture supernatant with or without EtOH (60 or 300 mL/L) addition (n = 5, each group). Data are mean ± SEM. P values were calculated using the Student’s t-test (e,f) or one-way analysis of variance (ANOVA) with Tukey’s multiple comparisons test (g,h). *P < 0.05; **P < 0.01; ***P < 0.001 vs. control. n.s. not significant.

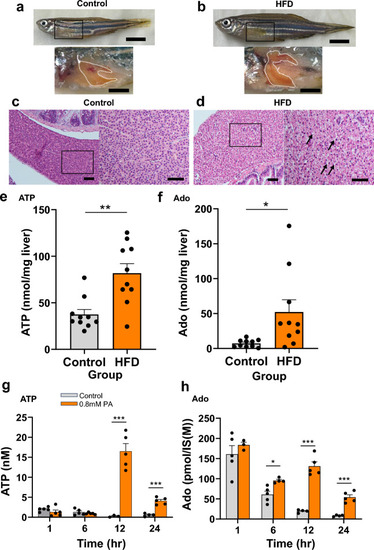
ATP and adenosine (Ado) content in the whole liver of adult zebrafish after high-fat diet (HFD) exposure and in HepG2 culture supernatant after palmitic acid (PA) treatment. (a,b) Gross appearance of zebrafish and liver (white dotted line) of zebrafish fed a control diet (a) or HFD (b) for 8 weeks. Scale bar 5 mm (top panel), 2 mm (bottom panel). (c,d) Representative hematoxylin and eosin (HE) staining of the liver sections from adult wild-type zebrafish fed a control diet (c) or HFD (d). Lipid droplets in the HFD-fed group are indicated with black arrows. Scale bar 50 µm (lower magnification) and 40 μm (higher magnification). (e,f) ATP (e) and Ado (f) content in the whole liver of adult zebrafish fed a control diet (control group) or HFD (n = 10, each group). (g,h) ATP (g) and Ado (h) content in HepG2 culture supernatant with or without PA (0.8 mM) treatment (n = 5, each group). Data are mean ± SEM. P values were calculated using the Student’s t-test (e,f) or one-way analysis of variance (ANOVA) with Tukey’s multiple comparisons test (g,h). *P < 0.05; **P < 0.01; ***P < 0.001 vs. control.

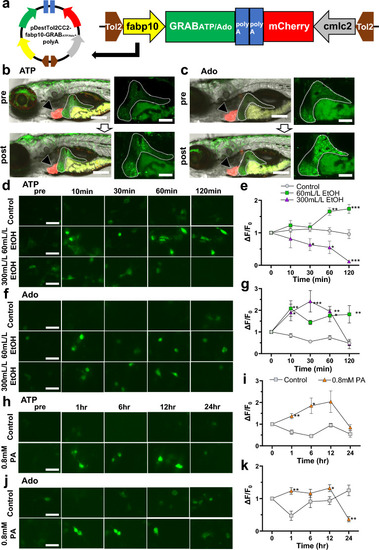
Establishment of hepatocyte-specific GRABATP and GRABAdo zebrafish models and confirmation of GRAB sensors in HepG2 cells. (a) Construction of pDestTol2-CC2-fabp10-GRABATP/-GRABAdo using In-fusion cloning. (b) Representative images of fabp10-GRABATP zebrafish 7 days postfertilization (dpf). Liver GFP fluorescence intensity was increased in response to 5 mM ATP treatment (bottom panel). Liver: white dotted line; mCherry-positive heart: black arrow. Scale bar 200 µm (left panel) and 100 µm (right panel). (c) Representative images of fabp10-GRABAdo zebrafish 7 dpf. Liver GFP fluorescence intensity was increased in response to 6 mM Ado treatment (bottom panel). Liver: white dotted line; mCherry-positive heart: black arrow. Scale bar 200 μm (left panel), 100 µm (right panel). (d,e) Representative images (d) and quantification of the change in GFP fluorescence intensity (e) in HepG2 cells transfected with pDisplay-CMV-GRABATP with or without EtOH (60 or 300 mL/L) treatment (n = 5–8, each group). Scale bar 50 μm. (f,g) Representative images (f) and quantification of the change in GFP fluorescence intensity (g) in HepG2 cells transfected with pDisplay-CMV-GRABAdo with or without EtOH (60 or 300 mL/L) treatment (n = 5–8, each group). Scale bar 50 μm. (h,i) Representative images (h) and quantification of the change in GFP fluorescence intensity (i) in HepG2 cells transfected with pDisplay-CMV-GRABATP with or without palmitic acid (PA; 0.8 mM) treatment (n = 5–8, each group). Scale bar 50 μm. (j,k) Representative images (j) and quantification of the change in GFP fluorescence intensity (k) in HepG2 cells transfected with pDisplay-CMV-GRABAdo, with or without PA (0.8 mM) treatment (n = 5–8, each group). Scale bar 50 μm. Data are mean ± SEM. *P < 0.05; **P < 0.01; ***P < 0.001 vs. Control.

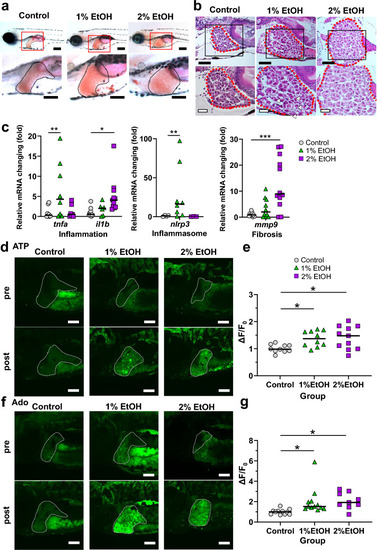
Ethanol treatment of zebrafish larvae increased the extrahepatic ATP and Ado levels. (a) Oil Red O staining of the liver (black line) of 6 days postfertilization (dpf) wild-type larvae with or without 1% or 2% ethanol (EtOH) exposure. Lower-magnification sagittal images (top panel) and higher-magnification images (bottom panel) are shown. Scale bar 200 µm. (b) Representative hematoxylin and eosin (HE)-stained images of the liver sections (red dotted line) from zebrafish larvae. Lipid droplets are seen in 1% EtOH-exposed larvae (white arrowheads). Scale bars 40 µm (top panel) and 20 µm (bottom panel). (c) Hepatic mRNA levels of inflammatory genes tnfa and il1b, inflammasome-related gene nlrp3, and fibrosis marker mmp9 were determined in zebrafish larvae with or without 1% or 2% EtOH exposure using qRT-PCR. (d,e) Representative images of the liver of GRABATP zebrafish larvae at 6 dpf. The GFP fluorescence intensity in the liver was increased in response to EtOH treatment (bottom panel). Liver: white dotted line. Scale bar 100 μm (d). Quantification of the change in the GFP fluorescence intensity in GRABATP zebrafish larvae with or without EtOH treatment (n = 10, 10, 11, each group) (e). (f,g) Representative images of the liver of GRABAdo zebrafish larvae at 6 dpf. The GFP fluorescence intensity in the liver was increased in response to EtOH treatment (bottom panel). Liver: white dotted line. Scale bar 100 μm (f). Quantification of the change in the GFP fluorescence intensity in GRABAdo zebrafish larvae with or without EtOH treatment (n = 11, 12, 9, each group) (g). Data are mean ± SEM. *P < 0.05; **P < 0.01; ***P < 0.001 vs. control.

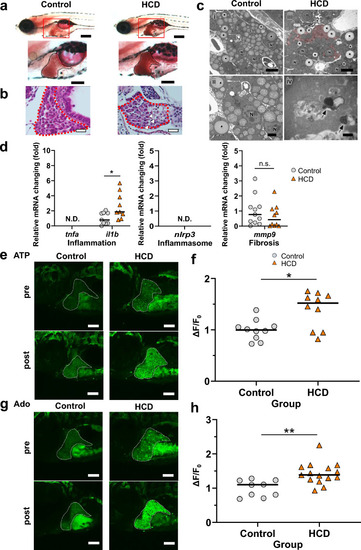
Cholesterol treatment of zebrafish larvae increased the extrahepatic ATP and Ado levels. (a) Oil Red O staining of the liver (black line) of 8 days postfertilization (dpf) wild-type larvae fed a normal (control) or 5% cholesterol (HCD) diet. Lower magnification sagittal images (top panel) and higher magnification images (bottom panel) are shown. Scale bar 200 µm. (b) Representative hematoxylin and eosin (HE)-stained images of the liver sections (red dotted line) from zebrafish larvae. Lipid droplets are seen in larvae fed a HCD (white arrowheads). Scale bar 20 µm. (c) Representative electron micrographs of the control and HCD groups. Lipid droplets (asterisks), glycogen accumulation (red painted area) and lysosomal phagocytosis (black arrows) are visible in the HCD group. The vacuoles often found in control samples were mitochondria. Scale bar 5.0 μm for (i,iii); 2.0 μm for (ii); 500 nm for (iv). (d) Hepatic mRNA levels of inflammatory genes tnfa and il1b, inflammasome-related gene nlrp3, and fibrosis marker mmp9 were determined in the control and HCD groups of zebrafish larvae using qRT-PCR. (e,f) Representative images of the liver of GRABATP zebrafish at 8 dpf. The GFP fluorescence intensity in the liver was increased in response to HCD treatment (bottom panel). Liver: white dotted line. Scale bar 100 μm (e). Quantification of the change in the GFP fluorescence intensity in GRABATP zebrafish larvae with or without cholesterol treatment (n = 10, each group) (f). (g,h) Representative images of the liver in GRABAdo zebrafish larvae at 8 dpf. The GFP fluorescence intensity in the liver was increased in response to HCD treatment (bottom panel). Liver: white dotted line. Scale bar 100 μm (g). Quantification of the change in the GFP fluorescence intensity in GRABAdo zebrafish larvae with or without HCD treatment (n = 9, 15, each group) (h). Data are mean ± SEM. *P < 0.05; **P < 0.01 vs. control. N.D. not detected, N nucleus, n.s. non-significant.

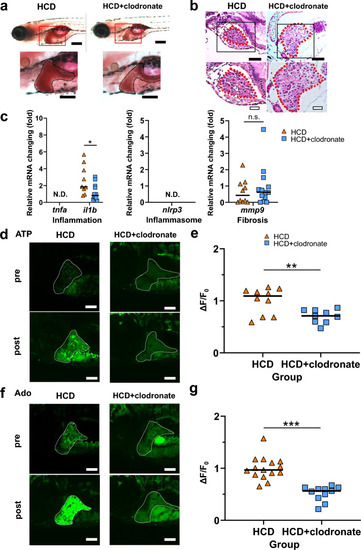
Clodronate improved the MASLD condition correlating with the reduction in extrahepatic ATP and adenosine (Ado) levels. (a) Oil red O staining of the liver (black line) of 8 days postfertilization (dpf) larvae fed a 5% cholesterol diet (HCD) with or without clodronate treatment. Lower-magnification sagittal images (top panel) and higher magnification images (bottom panel). Scale bar 200 µm. (b) Representative hematoxylin and eosin (HE)-stained images of the liver sections (red dotted line) of zebrafish larvae are shown. Lipid droplets are seen in HCD-fed larvae (white arrowheads). Scale bars 40 µm (top panel) and 20 µm (bottom panel). (c) Hepatic mRNA levels of inflammatory genes tnfa and il1b, inflammasome-related gene nlrp3, and fibrosis marker mmp9 were determined in HCD groups of zebrafish larvae with or without clodronate treatment using qRT-PCR. (d,e) Representative images of the liver in GRABATP zebrafish larvae at 8 dpf in the HCD group with or without clodronate treatment. High GFP fluorescence intensity in the liver induced by HCD was reduced by clodronate treatment (bottom panel). Liver: white dotted line. Scale bar 100 μm (d). Quantification of the change in the GFP fluorescence intensity in GRABATP zebrafish larvae without or with HCD treatment (n = 10, 9, each group) (e). (f,g) Representative images of the liver in GRABAdo zebrafish larvae at 8 dpf in the HCD group with or without clodronate treatment. High GFP fluorescence intensity in the liver induced by HCD was reduced by clodronate treatment (bottom panel). Liver: white dotted line. Scale bar 100 μm (d). Quantification of the change in the GFP fluorescence intensity in GRABAdo zebrafish larvae without or with HCD treatment (n = 15, 11, each group) (e). Data are mean ± SEM. *P < 0.05; **P < 0.01; ***P < 0.001 vs. control. N.D. not detected, HCD high-cholesterol diet, n.s. non-significant.

Acknowledgments
This image is the copyrighted work of the attributed author or publisher, and ZFIN has permission only to display this image to its users. Additional permissions should be obtained from the applicable author or publisher of the image. Full text @ Sci. Rep.