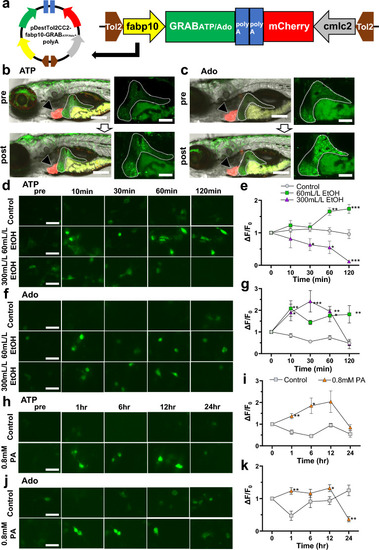
Establishment of hepatocyte-specific GRABATP and GRABAdo zebrafish models and confirmation of GRAB sensors in HepG2 cells. (a) Construction of pDestTol2-CC2-fabp10-GRABATP/-GRABAdo using In-fusion cloning. (b) Representative images of fabp10-GRABATP zebrafish 7 days postfertilization (dpf). Liver GFP fluorescence intensity was increased in response to 5 mM ATP treatment (bottom panel). Liver: white dotted line; mCherry-positive heart: black arrow. Scale bar 200 µm (left panel) and 100 µm (right panel). (c) Representative images of fabp10-GRABAdo zebrafish 7 dpf. Liver GFP fluorescence intensity was increased in response to 6 mM Ado treatment (bottom panel). Liver: white dotted line; mCherry-positive heart: black arrow. Scale bar 200 μm (left panel), 100 µm (right panel). (d,e) Representative images (d) and quantification of the change in GFP fluorescence intensity (e) in HepG2 cells transfected with pDisplay-CMV-GRABATP with or without EtOH (60 or 300 mL/L) treatment (n = 5–8, each group). Scale bar 50 μm. (f,g) Representative images (f) and quantification of the change in GFP fluorescence intensity (g) in HepG2 cells transfected with pDisplay-CMV-GRABAdo with or without EtOH (60 or 300 mL/L) treatment (n = 5–8, each group). Scale bar 50 μm. (h,i) Representative images (h) and quantification of the change in GFP fluorescence intensity (i) in HepG2 cells transfected with pDisplay-CMV-GRABATP with or without palmitic acid (PA; 0.8 mM) treatment (n = 5–8, each group). Scale bar 50 μm. (j,k) Representative images (j) and quantification of the change in GFP fluorescence intensity (k) in HepG2 cells transfected with pDisplay-CMV-GRABAdo, with or without PA (0.8 mM) treatment (n = 5–8, each group). Scale bar 50 μm. Data are mean ± SEM. *P < 0.05; **P < 0.01; ***P < 0.001 vs. Control.
|
