FIGURE

Figure 2

ID
ZDB-FIG-240404-68
Publication
Tokumaru et al., 2024 - Hepatic extracellular ATP/adenosine dynamics in zebrafish models of alcoholic and metabolic steatotic liver disease
Other Figures
All Figure Page
Back to All Figure Page
Figure 2

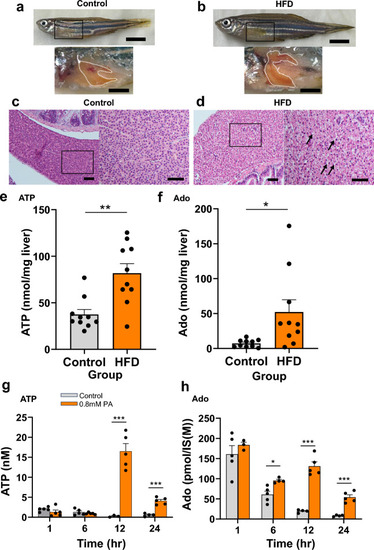
ATP and adenosine (Ado) content in the whole liver of adult zebrafish after high-fat diet (HFD) exposure and in HepG2 culture supernatant after palmitic acid (PA) treatment. (a,b) Gross appearance of zebrafish and liver (white dotted line) of zebrafish fed a control diet (a) or HFD (b) for 8 weeks. Scale bar 5 mm (top panel), 2 mm (bottom panel). (c,d) Representative hematoxylin and eosin (HE) staining of the liver sections from adult wild-type zebrafish fed a control diet (c) or HFD (d). Lipid droplets in the HFD-fed group are indicated with black arrows. Scale bar 50 µm (lower magnification) and 40 μm (higher magnification). (e,f) ATP (e) and Ado (f) content in the whole liver of adult zebrafish fed a control diet (control group) or HFD (n = 10, each group). (g,h) ATP (g) and Ado (h) content in HepG2 culture supernatant with or without PA (0.8 mM) treatment (n = 5, each group). Data are mean ± SEM. P values were calculated using the Student’s t-test (e,f) or one-way analysis of variance (ANOVA) with Tukey’s multiple comparisons test (g,h). *P < 0.05; **P < 0.01; ***P < 0.001 vs. control.

Expression Data

Expression Detail
Antibody Labeling
Phenotype Data

Phenotype Detail
Acknowledgments
This image is the copyrighted work of the attributed author or publisher, and ZFIN has permission only to display this image to its users. Additional permissions should be obtained from the applicable author or publisher of the image. Full text @ Sci. Rep.