FIGURE SUMMARY
Title

PKHD1L1, a gene involved in the stereocilia coat, causes autosomal recessive nonsyndromic hearing loss

Authors
Redfield, S.E., De-la-Torre, P., Zamani, M., Wang, H., Khan, H., Morris, T., Shariati, G., Karimi, M., Kenna, M.A., Seo, G.H., Xu, H., Lu, W., Naz, S., Galehdari, H., Indzhykulian, A.A., Shearer, A.E., Vona, B.
Source
Full text @ Hum. Genet.

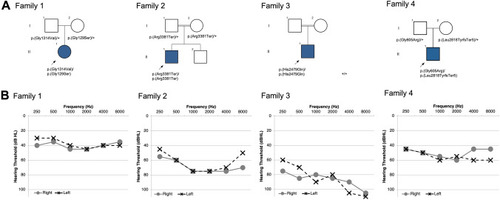
Pedigrees and audiograms. Pedigree and audiometric information for four families with biallelic PKHD1L1 variations. a Pedigrees for Families 1–4. Each proband with SNHL is indicated with shading and arrow. b Pure-tone audiometry for probands 1–4; x represents results for the left ear and o represents the right. Audiometric evaluation performed at the age of 13-, 9-, 12-, and 8-years-old for probands 1–4, respectively

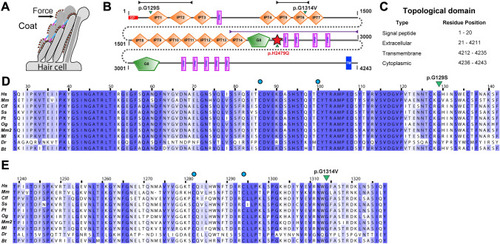
PKHD1L1 protein domain prediction and evolutionary analysis for missense variants (Family 1 and Family 3). a Schematic of a hair-cell stereocilia bundle under force stimulation highlighting the stereocilia surface coat. b Protein domain composition prediction from SMART using the Hs PKHD1L1 protein sequence as in NCBI accession code NP_803875.2, including the signal peptide (20 amino acids are predicted for Hs PKHD1L1 according to SMART. See Supplementary Table S1). Positions of each missense variant reported in this study are presented with a green arrowhead. The red star represents a newly predicted TMEM2-like domain. Black and purple arrow-headed lines represent the sequence fragments used for AlphaFold2 modeling of IPT1-2, IPT5-6, and TMEM2-like domain, respectively. c Topological description of Hs PKHD1L1 protein sequence as a reference. d, e Multiple protein sequence alignments comparing IPT1 and IPT6 domains among ten different PKHD1L1 orthologs, respectively (see Supplementary Table S1 for details about the selected species and Supplementary Fig. S3 for full PKHD1L1 sequence alignment). IPT1 has a pairwise sequence identity conservation of 82.3%, while IPT6 has a pairwise sequence identity of 74.9% across ten different orthologs. An independent % sequence identity analysis of only Hs and Mm species for IPT1 and IPT6 shows 82.9% and 77.8%, respectively (sequence alignment not shown). Missense variants are highlighted by green triangles. Blue circles represent cysteine residues forming disulfide bonds. Each alignment was color-coded for sequence similarity (35% threshold) using Jalview. White-colored residues report the lowest similarity and dark blue report the highest (see Methods). PKHD1L1 orthologs were chosen based on sequence availability and taxonomical diversity (Choudhary et al. 2020; De-la-Torre et al. 2018; Jaiganesh et al. 2018)

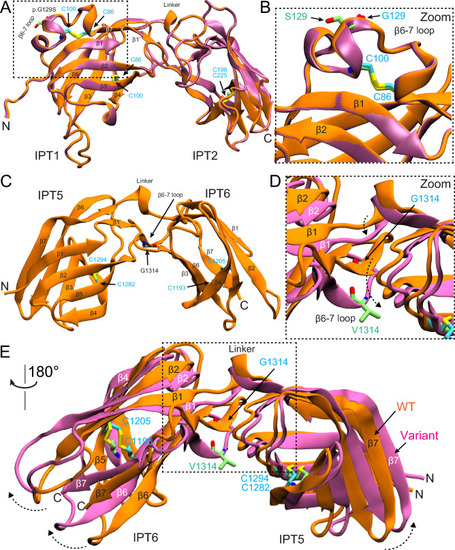
AlphaFold2 modeling of PKHD1L1 protein fragments carrying p.(Gly120Ser) and p.(Gly1314Val) mutations. a Superposed AlphaFold2 models of both native Hs IPT1-2 (orange) and Hs IPT1-2 p.(Gly120Ser) variant (mauve) are shown. b Higher magnification image of the mutated site. p.S129 in lime and p.G129 in cyan. No apparent structural changes are predicted by AlphaFold2. c Structural model of Hs IPT5-6 showing the native p.Gly1314 position. d Superposed Hs IPT5-6 (orange) and Hs IPT5-6 p.(Gly1314Val) (mauve) structures showing a structural change predicted by AlphaFold2 as a result of p.(Gly1314Val) substitution. β-strands and loops do not overlap, with a dashed black arrow reporting the loop shift. e Higher magnification image of the mutated site showing the conformation change of β-strands and loops. p.V1314 (lime) causes steric hindrance in the area inducing an expanded conformation to the variant structure in mauve. See dashed arrows

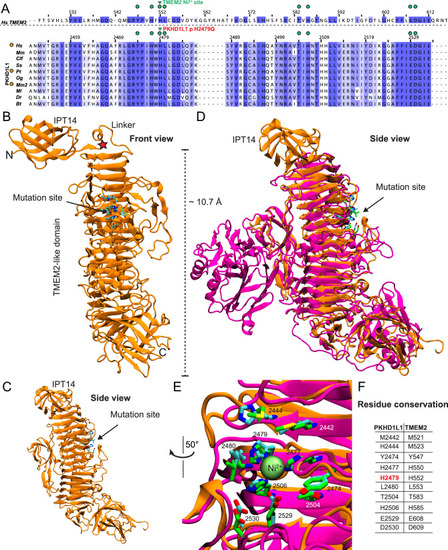
PKHD1L1 structural modeling of the protein fragment containing the p.(His2479Gln) variant. Based on AlphaFold2 predictions, this fragment of PKHD1L1 shares a common fold with the TMEM2 protein within the region carrying the p.(His2479Gln) variant. a Protein sequence alignment of a protein segment of Hs TMEM2 against ten different PKHD1L1 orthologs (see Supplementary Table S1 for details of the selected species, Supplementary Fig. S4 for sequence alignment of this specific fragment, and Supplementary Fig. S3 for full PKHD1L1 sequence alignment). Residue numbering for TMEM2 as in PDB: 8C6I (Niu et al. 2023), while residue numbering for Hs PKHD1L1 as in NCBI accession code NP_803875.2 with the signal peptide included (Supplementary Table S1, 26 residues are suggested according to protein sequence alignment, see Methods). Green triangles point to the location of the Hs p.(His2479Gln) variant, orange circles (left) indicate 100% amino acid sequence identity for this PKHD1L1 fragment between the Hs, Pt, and Mm2 species (See supplementary Table S1 for details about the selected orthologs). Green circles represent depicted residues in panels b–e. The alignment was color-coded for sequence similarity (35% threshold) using Jalview. White-colored residues show the lowest similarity and dark blue report the highest (see Methods). PKHD1L1 orthologs were chosen based on sequence availability and taxonomical diversity. b The simulated protein structure covering the protein fragment highlighted by purple arrow-headed line in Fig. 2b. Front view of the structure showing IPT14 linked to the PKHD1L1 TMEM2-like domain. The red star points to the linker connection. Residues at the mutation site are depicted as cyan sticks. c Side view from panel a showing a clear view of the stacked β-strand motifs. d Superposed structural protein alignment between WT Hs PKHD1L1 TMEM2-like domain model (orange) with the X-ray crystal structure of Hs TMEM2 protein (PDB: 8C6I, magenta). Residues at the native TMEM2-histidine-finger site are depicted as green sticks. e Higher magnification image of the potential conserved histidine-finger site between PKHD1L1 (orange) and TMEM2 (magenta) protein fragments and the Ni2+ ion shown as lime sphere. f Displayed residues between both proteins surrounding the Ni2+-ion site highlighted in panel a in green circles

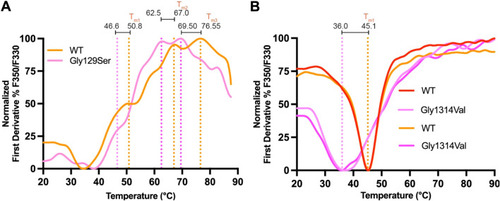
Thermodynamic and folding stability evaluation of two missense variants using NanoDSF. a NanoDSF melting temperatures for WT Mm IPT1-3 (orange) and Mm IPT1-3 p.(Gly129Ser) variant (pink). Measurements show at least three Tm peaks (orange dotted line) for the WT IPT1-3, likely because the protein fragment includes multiple IPT domains that unfold sequentially. Measured Tm values are shifted to the left (pink dotted line) showing a decrease of the thermal-folding stability. Temperatures are labeled for each Tm transition point. b Results for WT Mm IPT5-6 and Mm IPT5-6 p.(Gly1314Val) showing a reduced thermal stability (TWO replicates, see Methods section). Traces correspond to the normalized first derivate of the fluorescence ratio showing the inflection point of the fluorescence ratio, which corresponds to the melting temperature of the sample. Tonset values and protein purification experiments are shown in Supplementary Fig. S5

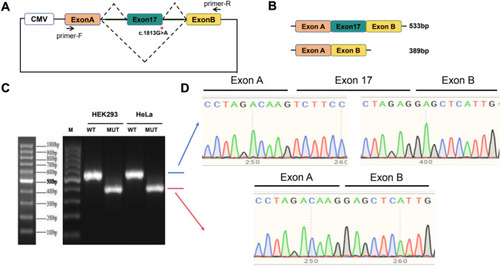
Minigene splicing assay for evaluation of the functional effect of p.(Gly605Arg) on splicing. a Schematic demonstrating designed minigene assay including CMV promotor, variant location, and primers. b Schematic showing calculated size of the fragment with exon 17 included (533 bp) or excluded (389 bp). c, d RT-PCR result from HEK293 and HeLa cells transfected with both WT and mutant plasmids showing different fragment lengths as well as sequence on chromatogram demonstrating lack of incorporation of exon 17 in cells transfected with the mutant plasmid, leading to in-frame deletion of 48 amino acids (p.Val557_Arg604del) using the NCBI NP_803875.2 as a reference sequence

Acknowledgments
This image is the copyrighted work of the attributed author or publisher, and ZFIN has permission only to display this image to its users. Additional permissions should be obtained from the applicable author or publisher of the image. Full text @ Hum. Genet.