IMAGE

Fig. 3

ID
ZDB-IMAGE-240426-80
Source
Figures for Redfield et al., 2024
Image
Figure Caption

Fig. 3

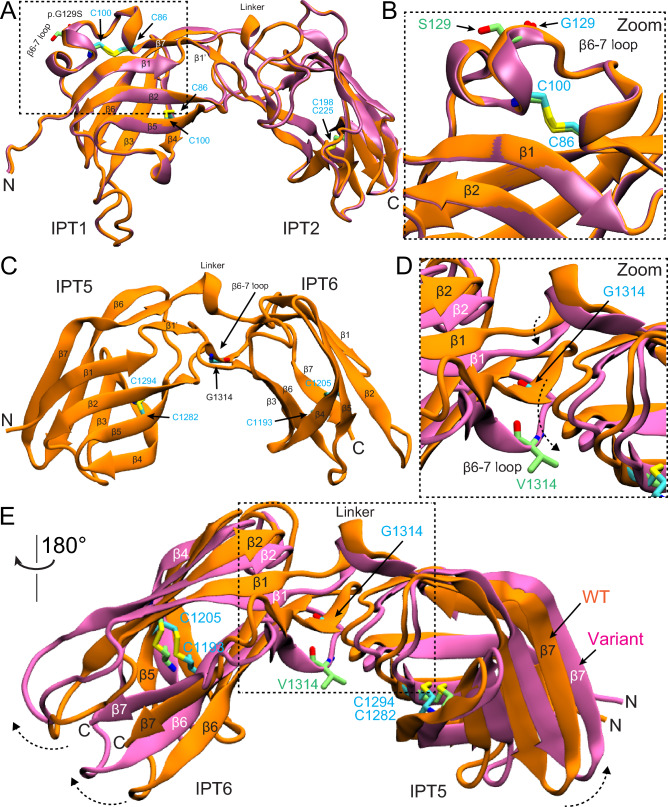
AlphaFold2 modeling of PKHD1L1 protein fragments carrying p.(Gly120Ser) and p.(Gly1314Val) mutations. a Superposed AlphaFold2 models of both native Hs IPT1-2 (orange) and Hs IPT1-2 p.(Gly120Ser) variant (mauve) are shown. b Higher magnification image of the mutated site. p.S129 in lime and p.G129 in cyan. No apparent structural changes are predicted by AlphaFold2. c Structural model of Hs IPT5-6 showing the native p.Gly1314 position. d Superposed Hs IPT5-6 (orange) and Hs IPT5-6 p.(Gly1314Val) (mauve) structures showing a structural change predicted by AlphaFold2 as a result of p.(Gly1314Val) substitution. β-strands and loops do not overlap, with a dashed black arrow reporting the loop shift. e Higher magnification image of the mutated site showing the conformation change of β-strands and loops. p.V1314 (lime) causes steric hindrance in the area inducing an expanded conformation to the variant structure in mauve. See dashed arrows

Acknowledgments
This image is the copyrighted work of the attributed author or publisher, and ZFIN has permission only to display this image to its users. Additional permissions should be obtained from the applicable author or publisher of the image. Full text @ Hum. Genet.