
- Title
-
The antagonistic transcription factors, EspM and EspN, regulate the ESX-1 secretion system in M. marinum
- Authors
- Nicholson, K.R., Cronin, R.M., Prest, R.J., Menon, A.R., Yang, Y., Jennisch, M.K., Champion, M.M., Tobin, D.M., Champion, P.A.
- Source
- Full text @ MBio
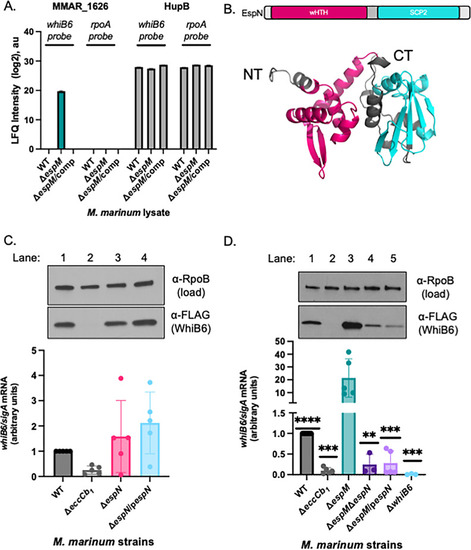
EspN binds the |
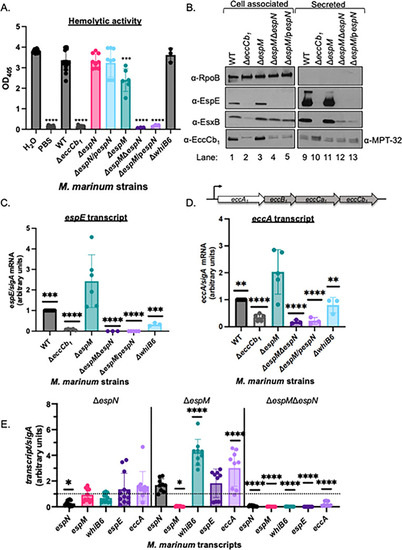
EspN and EspM control transcription of ESX-1 components and substrates. (A) Sheep red blood cell lysis measuring hemolytic activity of |
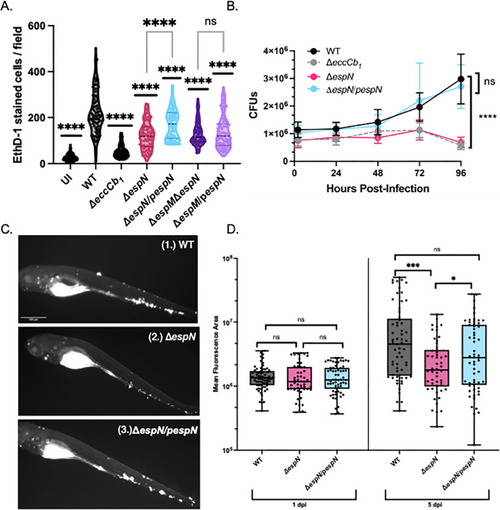
EspN is required for pathogenesis. (A) CFU of |
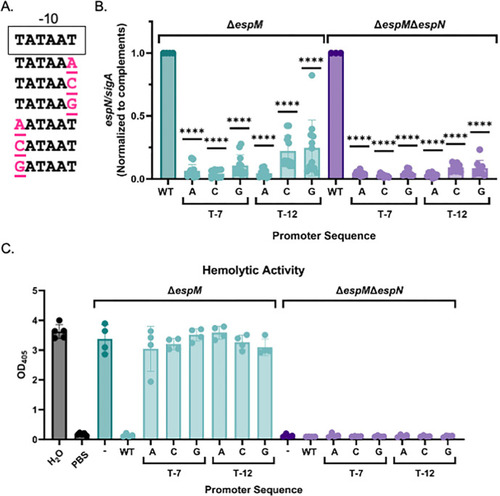
High levels of EspN transcription are required for dominance in the Δ |
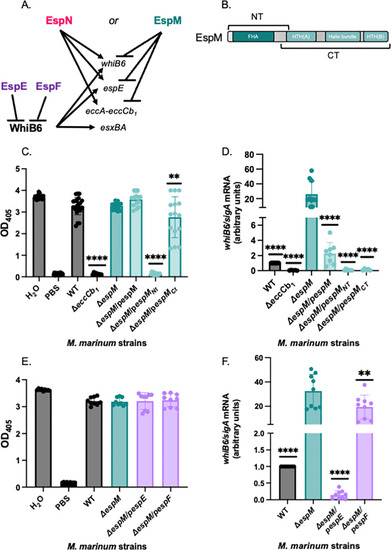
Overexpression of the EspM N-terminus or EspE negatively impacts ESX-1 transcription in the absence of EspM. (A) Schematic of transcriptional regulation by EspM, EspN, and WhiB6. EspE and EspF are ESX-1 substrates that negatively regulate the WhiB6 transcription factor ( |