IMAGE

Fig 2

ID
ZDB-IMAGE-240412-51
Source
Figures for Nicholson et al., 2024
Image
Figure Caption

Fig 2

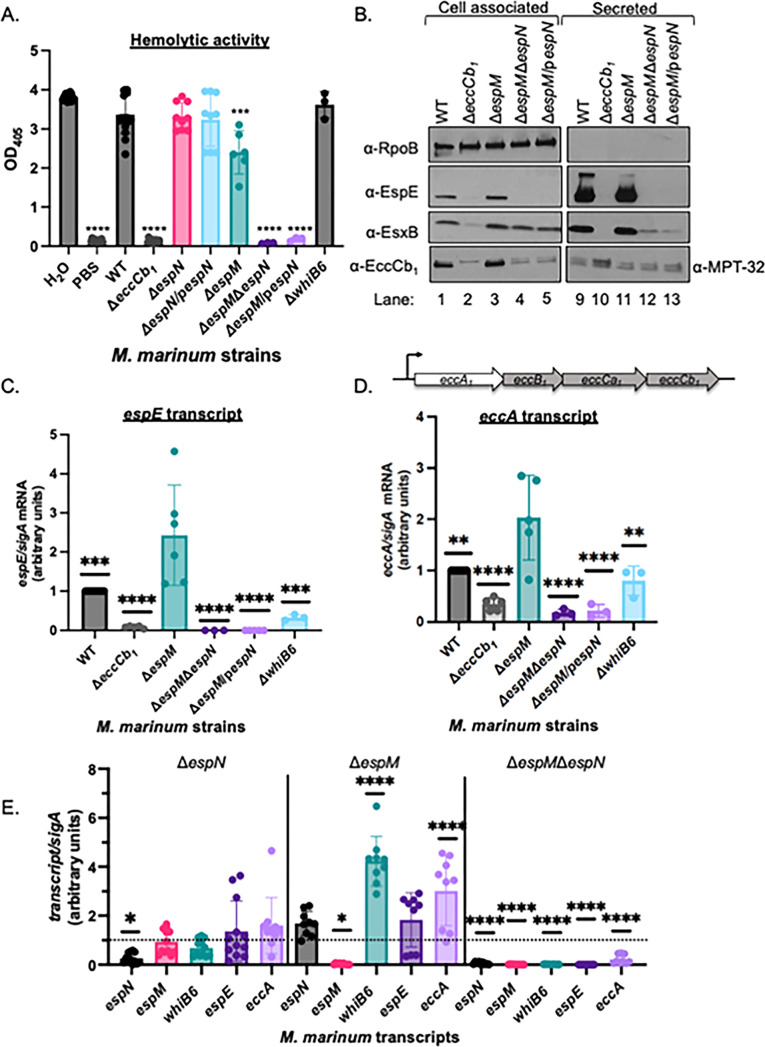
EspN and EspM control transcription of ESX-1 components and substrates. (A) Sheep red blood cell lysis measuring hemolytic activity of M. marinum. Statistical analysis was performed using ordinary one-way ANOVA followed by Dunnett’s multiple comparisons test relative to the WT strain. ****P < 0.0001, ***P = 0.0003. Data include three biological replicates each in technical triplicate. (B) Western blot of 10 µg of M. marinum cell-associated proteins. All strains include a whiB6-Fl allele. RpoB is a control for lysis. MPT-32 is a loading control for the secreted fractions. Blot is representative of three independent biological replicates. (C) Relative qRT analysis of the espE transcript compared to sigA transcript levels in M. marinum. Statistical analysis was performed using ordinary one-way ANOVA (P < 0.0001) followed by Tukey’s multiple comparisons test. Significance is shown relative to the ΔespM strain. ***P = 0.0010 (WT), ****P < 0.0001, ***P = 0.0003 (ΔwhiB6). (D) Relative qRT analysis of the eccA transcript compared to sigA transcript levels in M. marinum. Statistical analysis was performed using ordinary one-way ANOVA (P < 0.0001) followed by Tukey’s multiple comparisons test. Significance shown relative to the ΔespM strain. **P = 0.0012 (WT), P = 0.0026 (ΔwhiB6); ****P < 0.0001. (E) Relative qRT-PCR of the espN, espM, whiB6, espE, and eccA transcripts during macrophage infection. RAW 264.7 cells were infected with a multiplicity of infection of 20, and M. marinum strains were isolated at 4 hours post-infection. Outliers were identified using Robust regression and Outlier(ROUT) analysis, Q = 0.05%. Statistical analysis was performed using ordinary one-way ANOVA (P = 0.0004 for ΔespN, P < 0.0001 for ΔespM and ΔespMΔespN) followed by Dunnett’s multiple comparisons test relative to the WT strain (dotted line) in each strain. For ΔespN, *P = 0.0352, ΔespM, *P = 0.0320, ****P < 0.0001; for ΔespMΔespN, ****P < 0.0001. For all qRT-PCR, data include three independent biological replicates each in technical triplicate.

Acknowledgments
This image is the copyrighted work of the attributed author or publisher, and ZFIN has permission only to display this image to its users. Additional permissions should be obtained from the applicable author or publisher of the image. Full text @ MBio