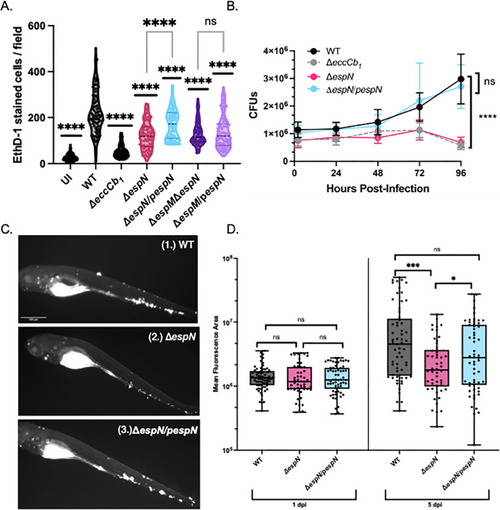
EspN is required for pathogenesis. (A) CFU of M. marinum strains (MOI = 0.2). The data points are the average of three independent biological replicates. Significance was determined using ordinary two-way ANOVA (P < 0.0001) followed by Tukey’s multiple comparisons test compared to the WT strain. The significance shown is compared to the WT strain at 96 hours post-infection (P < 0.0001). The ΔeccCb1 and ΔespN strains were also significantly different from the WT strain at 72 hpi (P = 0.0021 and P = 0.0024, respectively). (B)M. marinum burden in zebrafish infection measured using bacterial mCerulean fluorescence. Data are composed of two biological replicates with 20–30 independent infections per replicate. Statistical analyses were performed using one-way ANOVA followed by Tukey’s multiple comparisons of each group to the WT strain (***P = 0.00012, *P = 0.021). (C) Representative images of zebrafish infected with an initial dose of 150–200 fluorescent bacilli for (1.) WT, (2.) ΔespN, or (3.) ΔespN/pespN at 5 days post-infection. Scale bar is 500 µm. (D) Macrophage cytolysis as measured by EthD-1 staining 24 hours post-infection with M. marinum at an MOI of 4. Statistical analysis was performed using one-way ANOVA followed by Dunnett’s multiple comparisons test relative to the WT strain (****P < 0.0001). Each dot represents the number of EthD-1-stained cells in a single field. A total of 10 fields were counted using ImageJ for each well. Processing of three wells was performed for each biological replicate. A total of 90 fields were counted for each strain. CFU, colony-forming unit; ns, not significant.
|
