IMAGE

Fig 4

ID
ZDB-IMAGE-240412-53
Source
Figures for Nicholson et al., 2024
Image
Figure Caption

Fig 4

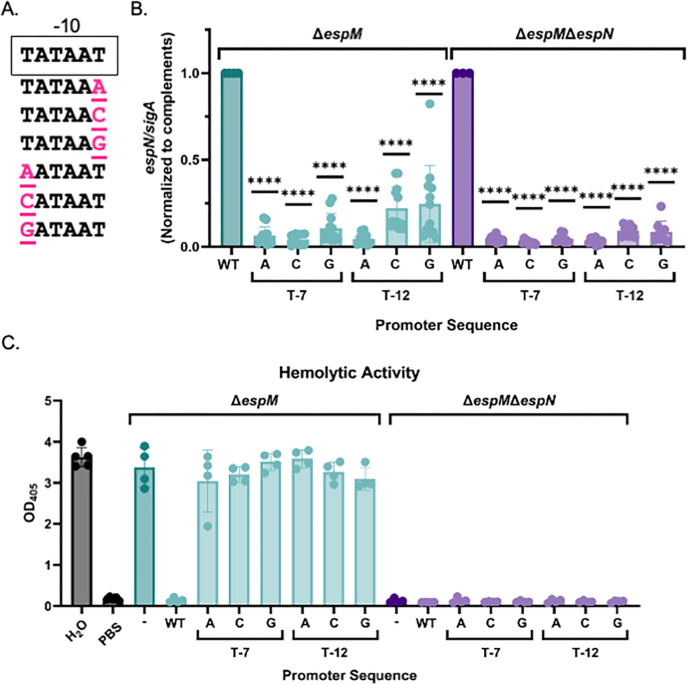
High levels of EspN transcription are required for dominance in the ΔespM strain. (A) Schematic of the −10 region from the mycobacterial optimal promoter driving espN transcription. Pink residues are mutations in the −7 and −12 positions. (B) Relative qRT analysis of the espN transcript compared to sigA transcript levels in M. marinum. Outliers were identified using ROUT analysis, Q = 0.5%. Statistical analysis was performed using ordinary one-way ANOVA (P < 0.0001) followed by Dunnett’s multiple comparisons test. Significance is shown relative to the ΔespM/pespN or ΔespMΔespN/pespN strain. ****P < 0.0001. Data include three biological replicates each in technical triplicate. (C) sRBC lysis measuring hemolytic activity of M. marinum. Statistical analysis was performed using ordinary one-way ANOVA followed by Dunnett’s multiple comparisons test relative to the ΔespM or ΔespMΔespN strain. ****P < 0.0001. Data include three biological replicates each in technical triplicate.

Acknowledgments
This image is the copyrighted work of the attributed author or publisher, and ZFIN has permission only to display this image to its users. Additional permissions should be obtained from the applicable author or publisher of the image. Full text @ MBio