
- Title
-
Paternal starvation affects metabolic gene expression during zebrafish offspring development and lifelong fitness
- Authors
- Jimenez-Gonzalez, A., Ansaloni, F., Nebendahl, C., Alavioon, G., Murray, D., Robak, W., Sanges, R., Müller, F., Immler, S.
- Source
- Full text @ Mol. Ecol.
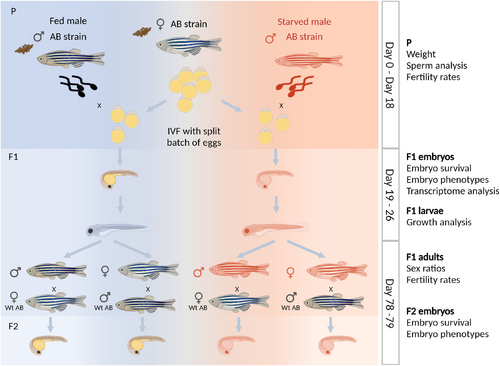
A zebrafish model to study the intergenerational effects of paternal starvation. Experimental design for IVF using a split-clutch design: All males from the AB strain were weighed at the beginning of the experiment (Day 0) and then randomly split into fed and starved groups. Starved males were fully deprived of food whereas fed males were fed a standard diet of a mix of dry and live (artemia) food three times a day. All males were kept with an equal number of females for the duration of the experiment. After 18 days, males were weighed again, and ejaculates were collected. Eggs were collected from healthy wild-type AB non-experimental females and split into two equal halves for IVF. Sperm from one fed and one starved male, respectively, were used to fertilise one half of the clutch of eggs. The sperm collected was used to fertilise eggs from two different females. On day 19, embryos were collected at prim-5 stage (24 hpf) for transcriptome analyses. Larval length was measured on days 5 and 8 postfertilisation. Part of the F1 larvae was grown to adulthood. F1 males and females were crossed to wildtype AB fish and their offspring was obtained by natural spawning. The phenotypes of the F2 embryos were studied at 2 and 24 hpf. The timeline of the experimental setup and data collected is shown on the right side of the design. Created with BioRender.com. |
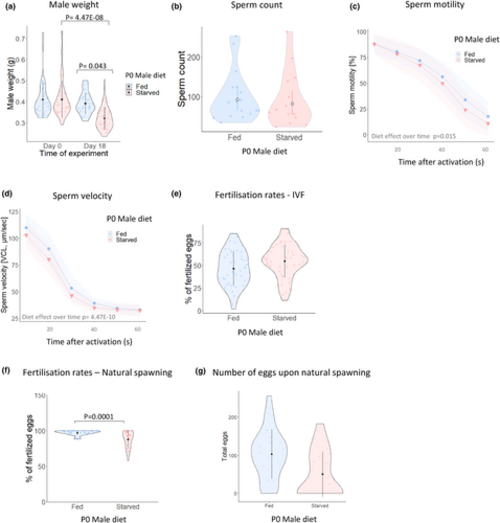
Starvation leads to altered male fertility traits. (a) Weight of fed and starved males on days 0 and 18 of the experiment. On day 18, the weight of starved males was significantly reduced by 21.83% in 3 independent experiments (starved group Day 0: 0.41 ± 0.08, Day 18: 0.321 ± 0.05, mean ± SD). Individual data points are represented as dots within the violin plots. N = 37. (b) Sperm count in fed and starved males. Bars represent the mean and 95% confidence intervals. (c) Percentage of sperm motility in fed and starved males across 6 time points after sperm activation. (d) Sperm velocity in fed and starved males at 6 time points after sperm activation. (e) Percentage of fertilised eggs at 64-cell stage (2 hpf) and produced by IVF. Individual data points within the violin plot represent the average egg survival rate per male and across 7 independent tanks. N = 49. (f) Percentage of fertilised eggs at 64-cell stage (2 hpf) and produced by natural spawning, Fed males N = 27, Starved males N = 32. Individual data points within the violin plots represent the average egg survival rate per male and across 3 independent rounds of breeding (g). Number of eggs produced per non-experimental females during natural spawning with fed or starved males. Black bars represent the mean ± SD. Shadowing in panels c and d represents 95% confidence intervals. |
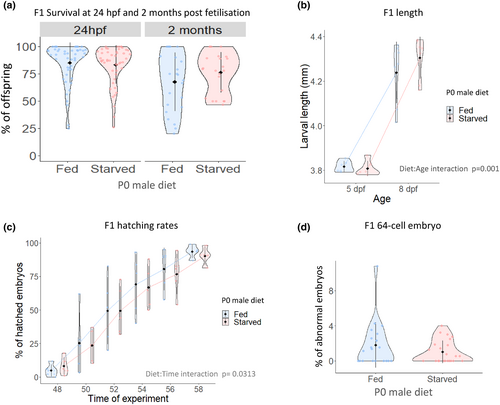
Paternal starvation significantly enhances larval growth but delays hatching. (a) F1 survival at 24 hpf (Left): The analysis of several embryo clutches revealed no statistically significant changes in survival between embryos from fed and starved fathers. Individual data points within the violin plot represent the average egg survival rate per male and across 7 independent tanks. F1 survival at 2 months post fertilization (Right). No significant differences were found at this stage. Individual data points within the violin plots represent average offspring survival (b). Larvae length: Larval growth was measured at 5 and 8 dpf in larvae from several clutches. Individual data points in the violin plot represent the average of larvae length per tank. (c) Hatching rates: The percentage of hatched embryos was analysed every 2 h between 48 and 58 hpf. (d) F1 abnormal eggs as determined at 64-cell stage (2 hpf). Eggs from males and females from fed and starved fathers were collected and analysed upon natural mating. No statistical differences were observed in the egg quality between groups or between groups and either sex. |
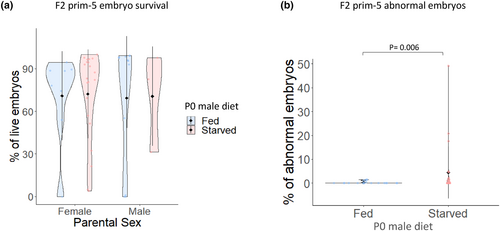
Paternal starvation does not alter F2 survival but is associated with F2 malformations at 24 hpf. (a) F2 survival at prim-5 (24 hpf): The analysis of several embryo clutches revealed no statistically significant changes on survival between embryos produced by the F1 (either females or males) of fed and starved fathers. Individual data points within the violin plot represent the average embryo survival rate per individual and produced by natural spawning. (b) F2 abnormal embryos at prim-5 stage (24 hpf). Increased number of abnormal embryos was observed in the group laid by F1 fish coming from starved fathers. No statistical differences were found when sex was considered as interaction factor. |

Paternal starvation leads to changes in embryo transcriptome in prim-5 embryos. (a) Differentially expressed genes in offspring of starved and fed fathers: Volcano plot depicting the differentially expressed genes between embryos from starved and fed fathers. We found 130 genes downregulated and 15 genes upregulated (only genes expressed >1TMM in 50% of the samples, FDR <0.1). A total of 6 samples for each group were included in the analysis. (b) Example of expression levels in downregulated (top: ctss2.1) and upregulated (bottom: klhl31) genes in offspring of starved fathers. Examples are given for all the embryos included in the transcriptomic analysis. (c) Differential expression within experimental groups and deregulated genes: Heatmap showing the variation in downregulated genes (top) and upregulated (bottom) between embryos from starved and fed fathers. (d) GO terms for upregulated genes in embryos from starved fathers. (e) GO terms for downregulated genes in embryos from starved fathers. |

The downregulated genes in the offspring of starved males are associated to metabolic processes, show preference for yolk and YSL expression and correlate with altered genes in adults exposed to starvation. (a) KEGG pathways enriched in downregulated genes. (b) Tissue enrichment of downregulated genes. (c) Transcription factor enrichment in the subset of downregulated genes. (d) Intersection analysis between the DEGs in the datasets from Jawahar et al. (2022) and this study (Odds ratio = 4.9617, p < .0001). |