
Fig. 2
- ID
- ZDB-FIG-240426-49
- Publication
- Jimenez-Gonzalez et al., 2024 - Paternal starvation affects metabolic gene expression during zebrafish offspring development and lifelong fitness
- Other Figures
- All Figure Page
- Back to All Figure Page
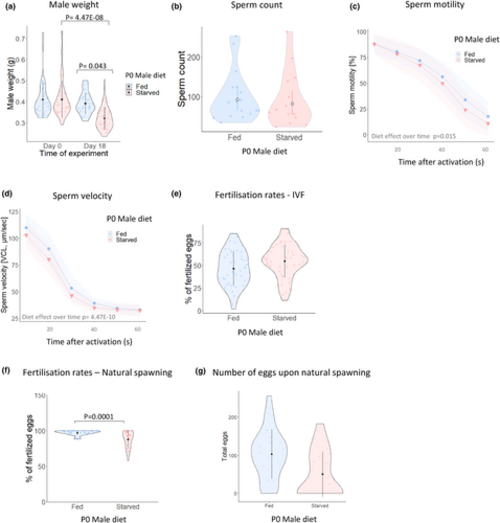
Starvation leads to altered male fertility traits. (a) Weight of fed and starved males on days 0 and 18 of the experiment. On day 18, the weight of starved males was significantly reduced by 21.83% in 3 independent experiments (starved group Day 0: 0.41 ± 0.08, Day 18: 0.321 ± 0.05, mean ± SD). Individual data points are represented as dots within the violin plots. N = 37. (b) Sperm count in fed and starved males. Bars represent the mean and 95% confidence intervals. (c) Percentage of sperm motility in fed and starved males across 6 time points after sperm activation. (d) Sperm velocity in fed and starved males at 6 time points after sperm activation. (e) Percentage of fertilised eggs at 64-cell stage (2 hpf) and produced by IVF. Individual data points within the violin plot represent the average egg survival rate per male and across 7 independent tanks. N = 49. (f) Percentage of fertilised eggs at 64-cell stage (2 hpf) and produced by natural spawning, Fed males N = 27, Starved males N = 32. Individual data points within the violin plots represent the average egg survival rate per male and across 3 independent rounds of breeding (g). Number of eggs produced per non-experimental females during natural spawning with fed or starved males. Black bars represent the mean ± SD. Shadowing in panels c and d represents 95% confidence intervals. |