
|
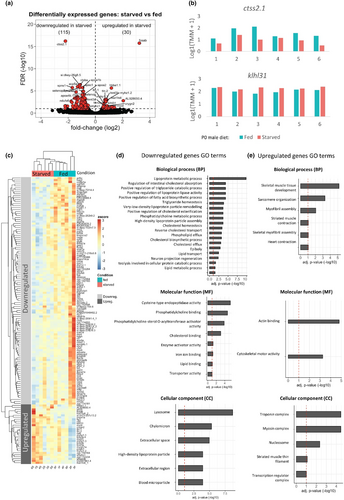
Fig. 5 Paternal starvation leads to changes in embryo transcriptome in prim-5 embryos. (a) Differentially expressed genes in offspring of starved and fed fathers: Volcano plot depicting the differentially expressed genes between embryos from starved and fed fathers. We found 130 genes downregulated and 15 genes upregulated (only genes expressed >1TMM in 50% of the samples, FDR <0.1). A total of 6 samples for each group were included in the analysis. (b) Example of expression levels in downregulated (top: ctss2.1) and upregulated (bottom: klhl31) genes in offspring of starved fathers. Examples are given for all the embryos included in the transcriptomic analysis. (c) Differential expression within experimental groups and deregulated genes: Heatmap showing the variation in downregulated genes (top) and upregulated (bottom) between embryos from starved and fed fathers. (d) GO terms for upregulated genes in embryos from starved fathers. (e) GO terms for downregulated genes in embryos from starved fathers.