
- Title
-
Treatment with sodium butyrate induces autophagy resulting in therapeutic benefits for spinocerebellar ataxia type 3
- Authors
- Watchon, M., Robinson, K.J., Luu, L., An, Y., Yuan, K.C., Plenderleith, S.K., Cheng, F., Don, E.K., Nicholson, G.A., Lee, A., Laird, A.S.
- Source
- Full text @ FASEB J.

SH-SY5Y cell culture modeling revealed the presence of ataxin-3 aggregates. (A) Immunoblotting SH-SY5Y cells with ataxin-3 confirmed expression of human ataxin-3-28Q and -84Q as well as endogenous ataxin-3. An additional high molecular weight (HMW) band above the 84Q monomeric band was found. (B) Quantification of human ataxin-3 monomers indicated increased ataxin-3 levels in ataxin-3 28Q and 84Q compared to the vector control (p < .001 and p = .0013, respectively; n = 6), and (C) quantification of the HMW ataxin-3 bands revealed that more HMW ataxin-3 was present in the ataxin-3 84Q cells compared to the other genotypes (p < .0001; n = 6). (D) Stably transfected SH-SY5Y cells were confirmed to express human ataxin-3 after immunostaining for ataxin-3. Cells expressing an empty vector control did not display aggregated ataxin-3, however, cells expressing either human ataxin-3-28Q, or ataxin-3-84Q displayed ataxin-3 positive aggregates (indicated by white arrows, scale bar: 20 μm). (E) Quantification of the number of aggregates present revealed that ataxin-3-84Q cells possessed a higher number of aggregates compared to ataxin-3 28Q and the vector control (p = .001 and p < .0001, respectively, n = 19–24). Results are shown as mean ± SEM. Statistical analysis was performed using a one-way ANOVA followed by a Tukey's post hoc test. **p < 0.01, ***p < 0.001, ****p < 0.0001. |
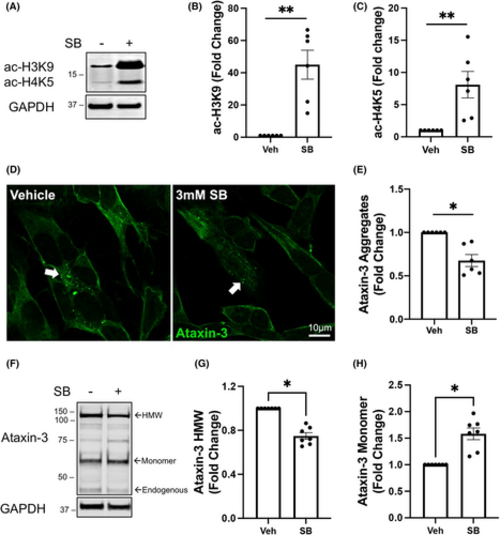
Treatment with sodium butyrate increases histone acetylation and affects ataxin-3 aggregation in SCA3 SH-SY5Y cells. (A) Western blots of SH-SY5Y stably expressing ataxin-3-84Q cells treated with 3 mM SB or vehicle control were probed for acetylated histone 3 at lysine 9 (ac-H3K9) and acetylated histone 4 at lysine 5 (ac-H4K5). (B) Densitometry of ac-H3K9 showed an increase with SB treatment compared to vehicle treatment (p = .0312). (C) Densitometry of ac-H4K5 revealed an increase with SB treatment compared to vehicle control (p = .0022, n = 6). (D) Immunostaining for ataxin-3 revealed a reduction in the amount of ataxin-3 positive aggregates after treatment with SB, compared to vehicle treatment (white arrows, scale bar: 10 μm). (E) Quantification of the number of ataxin-3 positive aggregates revealed decreased aggregates in SB-treated ataxin-3-84Q cells compared to the vehicle-treated control (p = .0022, n = 6). (F) Western blot of SH-SY5Y stably expressing ataxin-3-84Q cells treated with 3 mM SB or vehicle were probed for ataxin-3. (G) Densitometry of high molecular weight (HMW) ataxin-3 indicated that decreased HMW ataxin-3 was present following treatment with SB compared to vehicle control (p = .0156, n = 7). (H) Quantification of the ataxin-3 monomer levels following SB treatment increased compared to the vehicle control (p = .0156, n = 7). Data represent mean ± SEM. The statistical analysis was performed by Wilcoxon test. *p < 0.05, **p < 0.01. |
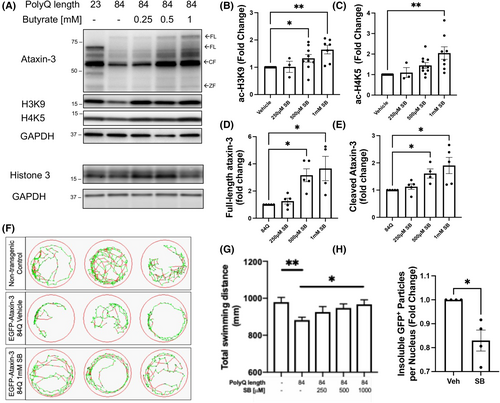
Sodium butyrate treatment increases histone acetylation and rescues the motor phenotype in SCA3 zebrafish. Zebrafish expressing ataxin-3 84Q were treated with 250 μM, 500 μM, or 1 mM sodium butyrate (SB), or vehicle control, between 1 and 6 days post fertilization (dpf). (A) Protein lysates of the 6 dpf zebrafish treated either SB or the vehicle control underwent western blotting and checked for ataxin-3, acetylated histone 3 at lysine 9 (ac-H3K9), and acetylated histone 4 at lysine 5 (ac-H4K5). Histone 3 was probed as a control. (B) Quantification of ac-H3K9 revealed a dose-dependent increase following SB treatment (500 μM, p = .0481; 1 mM, p = .0014, n = 3–9), while (C) quantification of ac-H4K5 revealed 1 mM SB was able to increase histone acetylation compared to the vehicle control (p = .0018, n = 3–10). (D) Quantification of full-length (FL) ataxin-3 revealed an increase with 500 μM and 1 mM SB (p = .039 and p = .0452, respectively, n = 4–5) while (E) levels of the cleavage fragment of ataxin-3 (CF) also demonstrated an increase with 500 μM and 1 mM SB treatment (p = .0452 and p = .0109, respectively, n = 4–5). (F) Swimming trajectories of 6 dpf zebrafish after treatment with vehicle versus 1 mM SB treatment (Green, slow movement; red, fast movement). (G) Motor behavior analysis showed vehicle-treated ataxin-3-84Q zebrafish swam shorter distances compared to the non-transgenic controls (p = .0085) while 6 dpf ataxin-3-84Q larvae treated with 1 mM SB ameliorated the motor dysfunction (p = .0393, n = 64–158). (H) Flow cytometric analysis of the insoluble GFP+ particles revealed a decrease with SB treatment compared with vehicle (p = .03, n = 4 group replicates). Data represent mean ± SEM. Statistical analysis was performed by a non-parametric one-way ANOVA (Kruskal Wallis) test and comparison between vehicle versus SB was analyzed using an unpaired student t-test. *p < 0.05, **p < 0.01. PHENOTYPE:
|
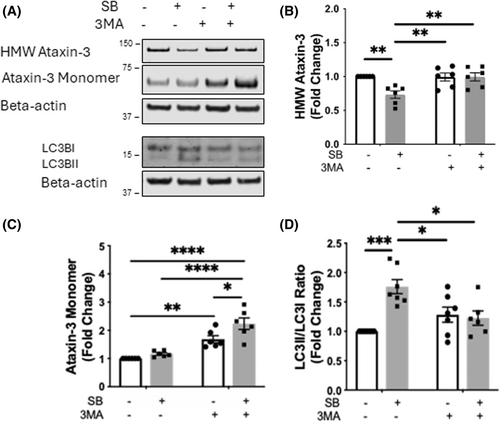
Removal of high molecular weight (HMW) ataxin-3 by sodium butyrate is mediated by autophagy. (A) Western blots were performed on protein lysates of SH-SY5Y cells stably expressing ataxin-3-84Q treated with sodium butyrate (SB, 3 mM) and/or 3MA (5 mM) for 72 h and probed for ataxin-3 and LC3B. (B) Quantification of HMW ataxin-3 indicated that SB treatment reduced the amount of HMW ataxin-3, compared to vehicle treatment (p = .0070), and addition of 3MA treatment alone or as a co-treatment prevented the removal of the HMW ataxin-3 (p = .0086 and p = .0079, respectively, n = 6). (C) Quantification of the ataxin-3 monomeric species increased with 3MA treatment compared to the vehicle control (p = .0036). SB+3MA co-treatment further increased ataxin-3 levels compared to vehicle, SB treatment alone, and 3MA treatment alone (p < .0001, p < .0001, and p = .0214, respectively, n = 6). (D) Quantification of the LC3II/LC3I ratio revealed an increased ratio with SB treatment (p = 0002) and the addition of 3MA alone or SB+3MA co-treatment prevented this decrease in LC3II/LC3I (p = .0176 and p = .0098, respectively; n = 6–7). Data represent mean ± SEM. Statistical analysis performed was a two-way ANOVA followed by a Tukey post hoc analysis. *p < 0.05, **p < 0.01, ***p < 0.001, ****p < 0.0001. |
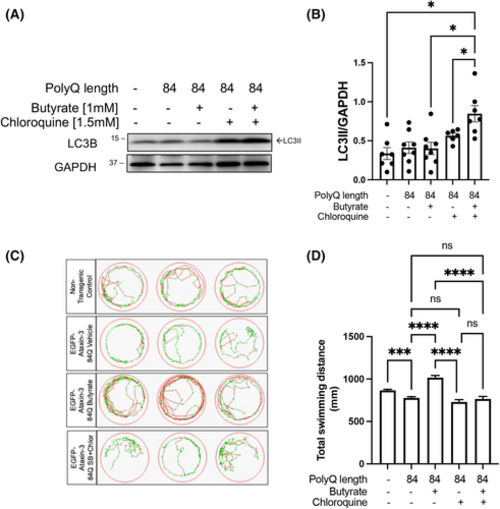
Treatment with sodium butyrate induces autophagy in the SCA3 zebrafish model producing beneficial effects on zebrafish swimming. (A) Western blots were performed on protein lysates from non-transgenic controls and ataxin-3-84Q zebrafish larvae treated with either 1 mM sodium butyrate (SB) alone, 1.5 mM chloroquine alone or co-treatment of SB and chloroquine, between 1 and 6 days post fertilization (dpf). The immunoblots were probed for LC3B. (B) Quantification of LC3II levels after treatment with 1 mM SB and/or 1.5 mM chloroquine found an increase with SB and chloroquine treatment compared to chloroquine treatment alone, SB treatment alone, and the non-transgenic controls (p = .0475, p = .0395 and p = .0303, respectively; n = 6–8). (C) Swimming trajectories of non-transgenic and SCA3 zebrafish treated with either vehicle control, 1 mM SB, 1.5 mM chloroquine, or SB/1.5 mM chloroquine and show that SB increases the amount of fast swimming and SB/chloroquine co-treatment decreases this (green, slow movement; red, fast movement). (D) Quantification of the total distance swum by each animal demonstrates that vehicle-treated SCA3 zebrafish has decreased swimming distance (p = .0009), SB treatment rescues the motor impairment seen in vehicle-treated ataxin-3-84Q zebrafish (p < .0001), and those receiving 1.5 mM chlor or SB/chlor co-treatment (p < .0001 and p < .0001, respectively, n = 81–260). Data represent mean ± SEM. Statistical analysis was performed using a one-way ANOVA followed by a Tukey post hoc test. ns, non-significant. *p < 0.05, ****p < 0.0001. PHENOTYPE:
|
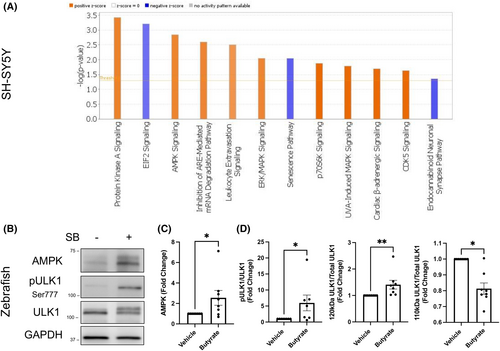
Proteomic analysis reveals upregulation of the Protein Kinase A and AMPK signaling pathway with SB treatment. (A) Ingenuity pathway analysis (IPA) predicted activation of the Protein Kinase A and AMPK signaling pathway upon SB treatment on ataxin-3-84Q expressing SH-SY5Y cells. Blue indicates IPA predicted an inhibition versus orange refers to an activation. (B) Immunoblots of ataxin-3-84Q zebrafish protein samples treated with SB or a vehicle control. Blots were probed with AMPK, phosphorylated ULK1 (Ser777) and ULK1. (C) Quantification revealed increased AMPK levels with SB treatment compared to vehicle-treated (p = .0209, n = 8). (D) Densitometric analysis revealed an increased pULK1/ULK1 ratio in the SB treatment compared to the vehicle-treated SCA3 zebrafish (p = .0469, n = 7). Quantification of ULK1 revealed increased ULK1 protein at 120 kDa relative to total ULK1 and decreased 110 kDa relative to total ULK1 in SB-treated SCA3 zebrafish compared to the vehicle control (p = .0078 and p = .0156, respectively; n = 8). Data represent mean ± SEM. Statistical analysis performed was a paired non-parametric t-test (Wilcoxon test). *p < 0.05, **p < 0.01. |