
|
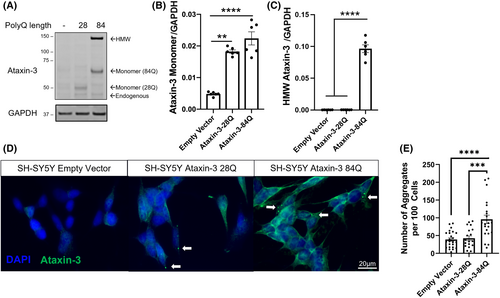
Fig. 1 SH-SY5Y cell culture modeling revealed the presence of ataxin-3 aggregates. (A) Immunoblotting SH-SY5Y cells with ataxin-3 confirmed expression of human ataxin-3-28Q and -84Q as well as endogenous ataxin-3. An additional high molecular weight (HMW) band above the 84Q monomeric band was found. (B) Quantification of human ataxin-3 monomers indicated increased ataxin-3 levels in ataxin-3 28Q and 84Q compared to the vector control (p < .001 and p = .0013, respectively; n = 6), and (C) quantification of the HMW ataxin-3 bands revealed that more HMW ataxin-3 was present in the ataxin-3 84Q cells compared to the other genotypes (p < .0001; n = 6). (D) Stably transfected SH-SY5Y cells were confirmed to express human ataxin-3 after immunostaining for ataxin-3. Cells expressing an empty vector control did not display aggregated ataxin-3, however, cells expressing either human ataxin-3-28Q, or ataxin-3-84Q displayed ataxin-3 positive aggregates (indicated by white arrows, scale bar: 20 μm). (E) Quantification of the number of aggregates present revealed that ataxin-3-84Q cells possessed a higher number of aggregates compared to ataxin-3 28Q and the vector control (p = .001 and p < .0001, respectively, n = 19–24). Results are shown as mean ± SEM. Statistical analysis was performed using a one-way ANOVA followed by a Tukey's post hoc test. **p < 0.01, ***p < 0.001, ****p < 0.0001.