FIGURE SUMMARY
Title

Inhibitory Effects of Jiuzao Polysaccharides on Alcoholic Fatty Liver Formation in Zebrafish Larvae and Their Regulatory Impact on Intestinal Microbiota

Authors
Li, Q., Wu, L., Wang, G., Zheng, F., Sun, J., Zhang, Y., Li, Z., Li, L., Sun, B.
Source
Full text @ Foods

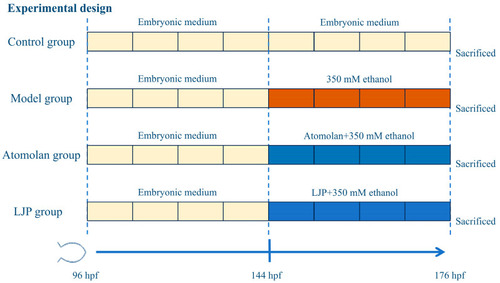
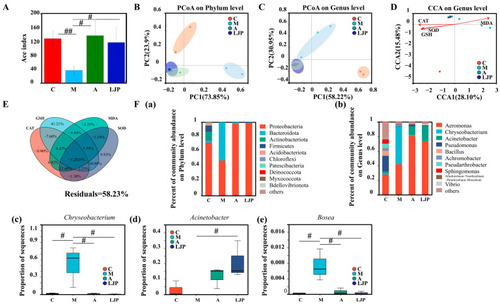
Experimental timeline for LJP feeding regime.

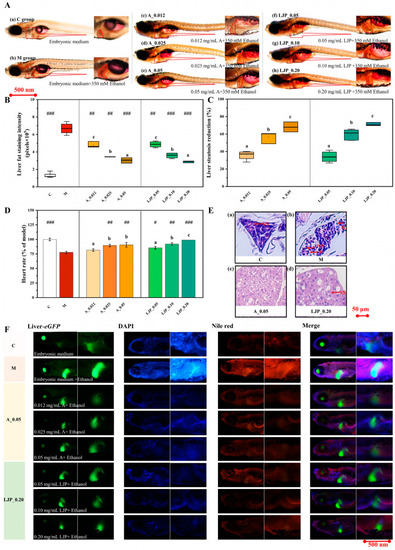
The liver visual phenotype of zebrafish larvae at 176 h post-fertilization. (
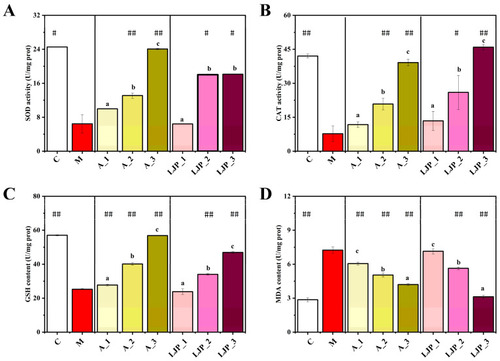
A) Oil Red O staining was utilized to observe lipid droplets in the entire body and liver of zebrafish larvae. (B) Liver Oil Red O staining was quantitatively analyzed using ImageJ software (version 1.53), with results expressed as a percentage relative to the M group (mean ± SD; n = 3). (C) The inhibition rate of liver steatosis was determined by Oil Red O staining. (D) The impact of LJP on the cardiac rate of zebrafish larvae was evaluated. # p < 0.05, ## p < 0.01, and ### p < 0.001 represent significant differences compared to the M group using the unpaired 2-tailed Student’s t-test. Different lowercase letters indicate significant differences between groups according to the One-way ANOVA followed by post hoc Duncan’s for multiple comparisons. (E) Histological images of zebrafish livers from control (a), model (b), A_0.05 (c), and LJP_0.20 (d) groups. (F) Nile red staining, coupled with nuclear DNA staining, revealed lipid droplets in the liver cells of zebrafish larvae.

Effect of Jiuzao polysaccharides on the activity of enzymes related to oxidative stress in zebrafish larvae with an alcoholic fatty liver. Enzymatic activities measured included superoxide dismutase (SOD) (A), catalase (CAT) (B), glutathione (GSH) (C), and malondialdehyde (MDA) (D). The values are expressed as the mean ± SD. Statistical significance was determined using the Student’s t-test, where # p < 0.05 and ## p < 0.01 indicate differences compared to the M group. Distinct lowercase letters denote significant differences between the three samples according to the One-way ANOVA followed by post hoc Duncan’s for multiple comparisons.

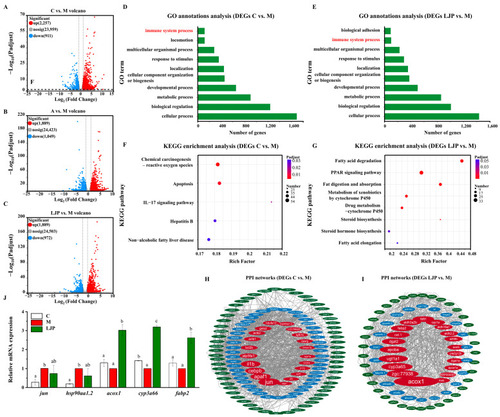
Identification of DEGs and construction of PPI network. (A) Volcano map of DEGs in the C vs. M group. (B) Volcano map of DEGs in the A vs. M group. (C) Volcano map of DEGs in the LJP vs. M group. (D) GO annotation analysis of DEGs in the C vs. M group. (E) GO annotation analysis of DEGs in the LJP vs. M. (F) KEGG enrichment analysis of DEGs in the C vs. M. (G) KEGG enrichment analysis of DEGs in the LJP vs. M group. (H) Interaction map of the protein-protein network of DEGs in the C vs. M group. (I) Interaction map of the protein-protein network of the DEGs in LJP vs. M group. (J) QRT-PCR examined the mRNA expression levels of selected genes. Different lowercase letters were significantly different between the three fractions according to the ANOVA with Duncan’s test (p < 0.05).

Jiuzao polysaccharides could improve ethanol-induced intestinal microbiota imbalance. Bar plots (A) illustrate the Ace index values for bacterial communities at the operational taxonomic unit (OTU) level, analyzed using Kruskal–Wallis nonparametric ANOVA, with # p < 0.05 and ## p < 0.01 indicating significance compared to the M group as per the Student’s t-test. β-diversity is presented through Principal Coordinate Analysis (PCoA) based on unweighted UniFrac distance metrics at the microbial phylum (B) and genus (C) levels. Canonical Correspondence Analysis (CCA) (D) and Variance Partitioning Analysis (VPA) (E) elucidate the composition and enzymatic activity correlations within the microbial community. The direction and length of the arrows in these analyses denote the strength and correlation between microbial communities and enzyme activities. The significance of differences between groups is shown in (F). Bar plots detail the microbial structure at both the phylum (a) and genus (b) levels. Intestinal bacteria exhibiting abundance differences at the genus level delineated in (ce).

Acknowledgments
This image is the copyrighted work of the attributed author or publisher, and ZFIN has permission only to display this image to its users. Additional permissions should be obtained from the applicable author or publisher of the image. Full text @ Foods