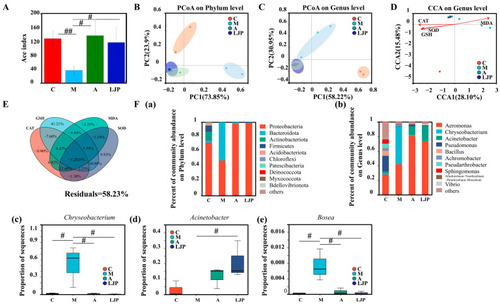
Jiuzao polysaccharides could improve ethanol-induced intestinal microbiota imbalance. Bar plots (A) illustrate the Ace index values for bacterial communities at the operational taxonomic unit (OTU) level, analyzed using Kruskal–Wallis nonparametric ANOVA, with # p < 0.05 and ## p < 0.01 indicating significance compared to the M group as per the Student’s t-test. β-diversity is presented through Principal Coordinate Analysis (PCoA) based on unweighted UniFrac distance metrics at the microbial phylum (B) and genus (C) levels. Canonical Correspondence Analysis (CCA) (D) and Variance Partitioning Analysis (VPA) (E) elucidate the composition and enzymatic activity correlations within the microbial community. The direction and length of the arrows in these analyses denote the strength and correlation between microbial communities and enzyme activities. The significance of differences between groups is shown in (F). Bar plots detail the microbial structure at both the phylum (a) and genus (b) levels. Intestinal bacteria exhibiting abundance differences at the genus level delineated in (c–e).
|
