IMAGE

Figure 2

ID
ZDB-IMAGE-240129-273
Source
Figures for Li et al., 2024
Image
Figure Caption

Figure 2

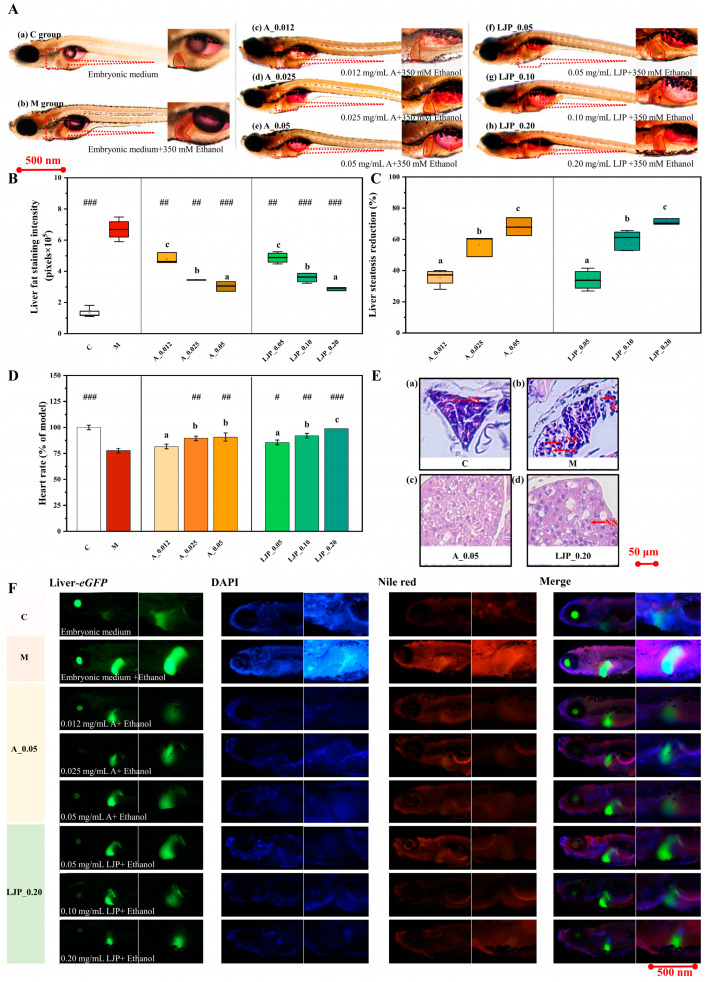
The liver visual phenotype of zebrafish larvae at 176 h post-fertilization. (A) Oil Red O staining was utilized to observe lipid droplets in the entire body and liver of zebrafish larvae. (B) Liver Oil Red O staining was quantitatively analyzed using ImageJ software (version 1.53), with results expressed as a percentage relative to the M group (mean ± SD; n = 3). (C) The inhibition rate of liver steatosis was determined by Oil Red O staining. (D) The impact of LJP on the cardiac rate of zebrafish larvae was evaluated. # p < 0.05, ## p < 0.01, and ### p < 0.001 represent significant differences compared to the M group using the unpaired 2-tailed Student’s t-test. Different lowercase letters indicate significant differences between groups according to the One-way ANOVA followed by post hoc Duncan’s for multiple comparisons. (E) Histological images of zebrafish livers from control (a), model (b), A_0.05 (c), and LJP_0.20 (d) groups. (F) Nile red staining, coupled with nuclear DNA staining, revealed lipid droplets in the liver cells of zebrafish larvae.

Acknowledgments
This image is the copyrighted work of the attributed author or publisher, and ZFIN has permission only to display this image to its users. Additional permissions should be obtained from the applicable author or publisher of the image. Full text @ Foods