FIGURE

Figure 4

ID
ZDB-FIG-240129-274
Publication
Li et al., 2024 - Inhibitory Effects of Jiuzao Polysaccharides on Alcoholic Fatty Liver Formation in Zebrafish Larvae and Their Regulatory Impact on Intestinal Microbiota
Other Figures
All Figure Page
Back to All Figure Page
Figure 4

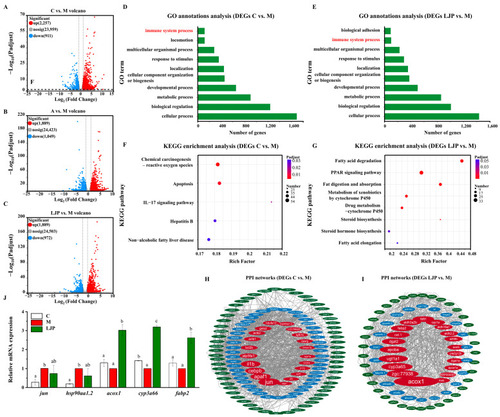
Identification of DEGs and construction of PPI network. (A) Volcano map of DEGs in the C vs. M group. (B) Volcano map of DEGs in the A vs. M group. (C) Volcano map of DEGs in the LJP vs. M group. (D) GO annotation analysis of DEGs in the C vs. M group. (E) GO annotation analysis of DEGs in the LJP vs. M. (F) KEGG enrichment analysis of DEGs in the C vs. M. (G) KEGG enrichment analysis of DEGs in the LJP vs. M group. (H) Interaction map of the protein-protein network of DEGs in the C vs. M group. (I) Interaction map of the protein-protein network of the DEGs in LJP vs. M group. (J) QRT-PCR examined the mRNA expression levels of selected genes. Different lowercase letters were significantly different between the three fractions according to the ANOVA with Duncan’s test (p < 0.05).

Expression Data

Expression Detail
Antibody Labeling
Phenotype Data

Phenotype Detail
Acknowledgments
This image is the copyrighted work of the attributed author or publisher, and ZFIN has permission only to display this image to its users. Additional permissions should be obtained from the applicable author or publisher of the image. Full text @ Foods